Analysis Report: DEMO
QC Metrics
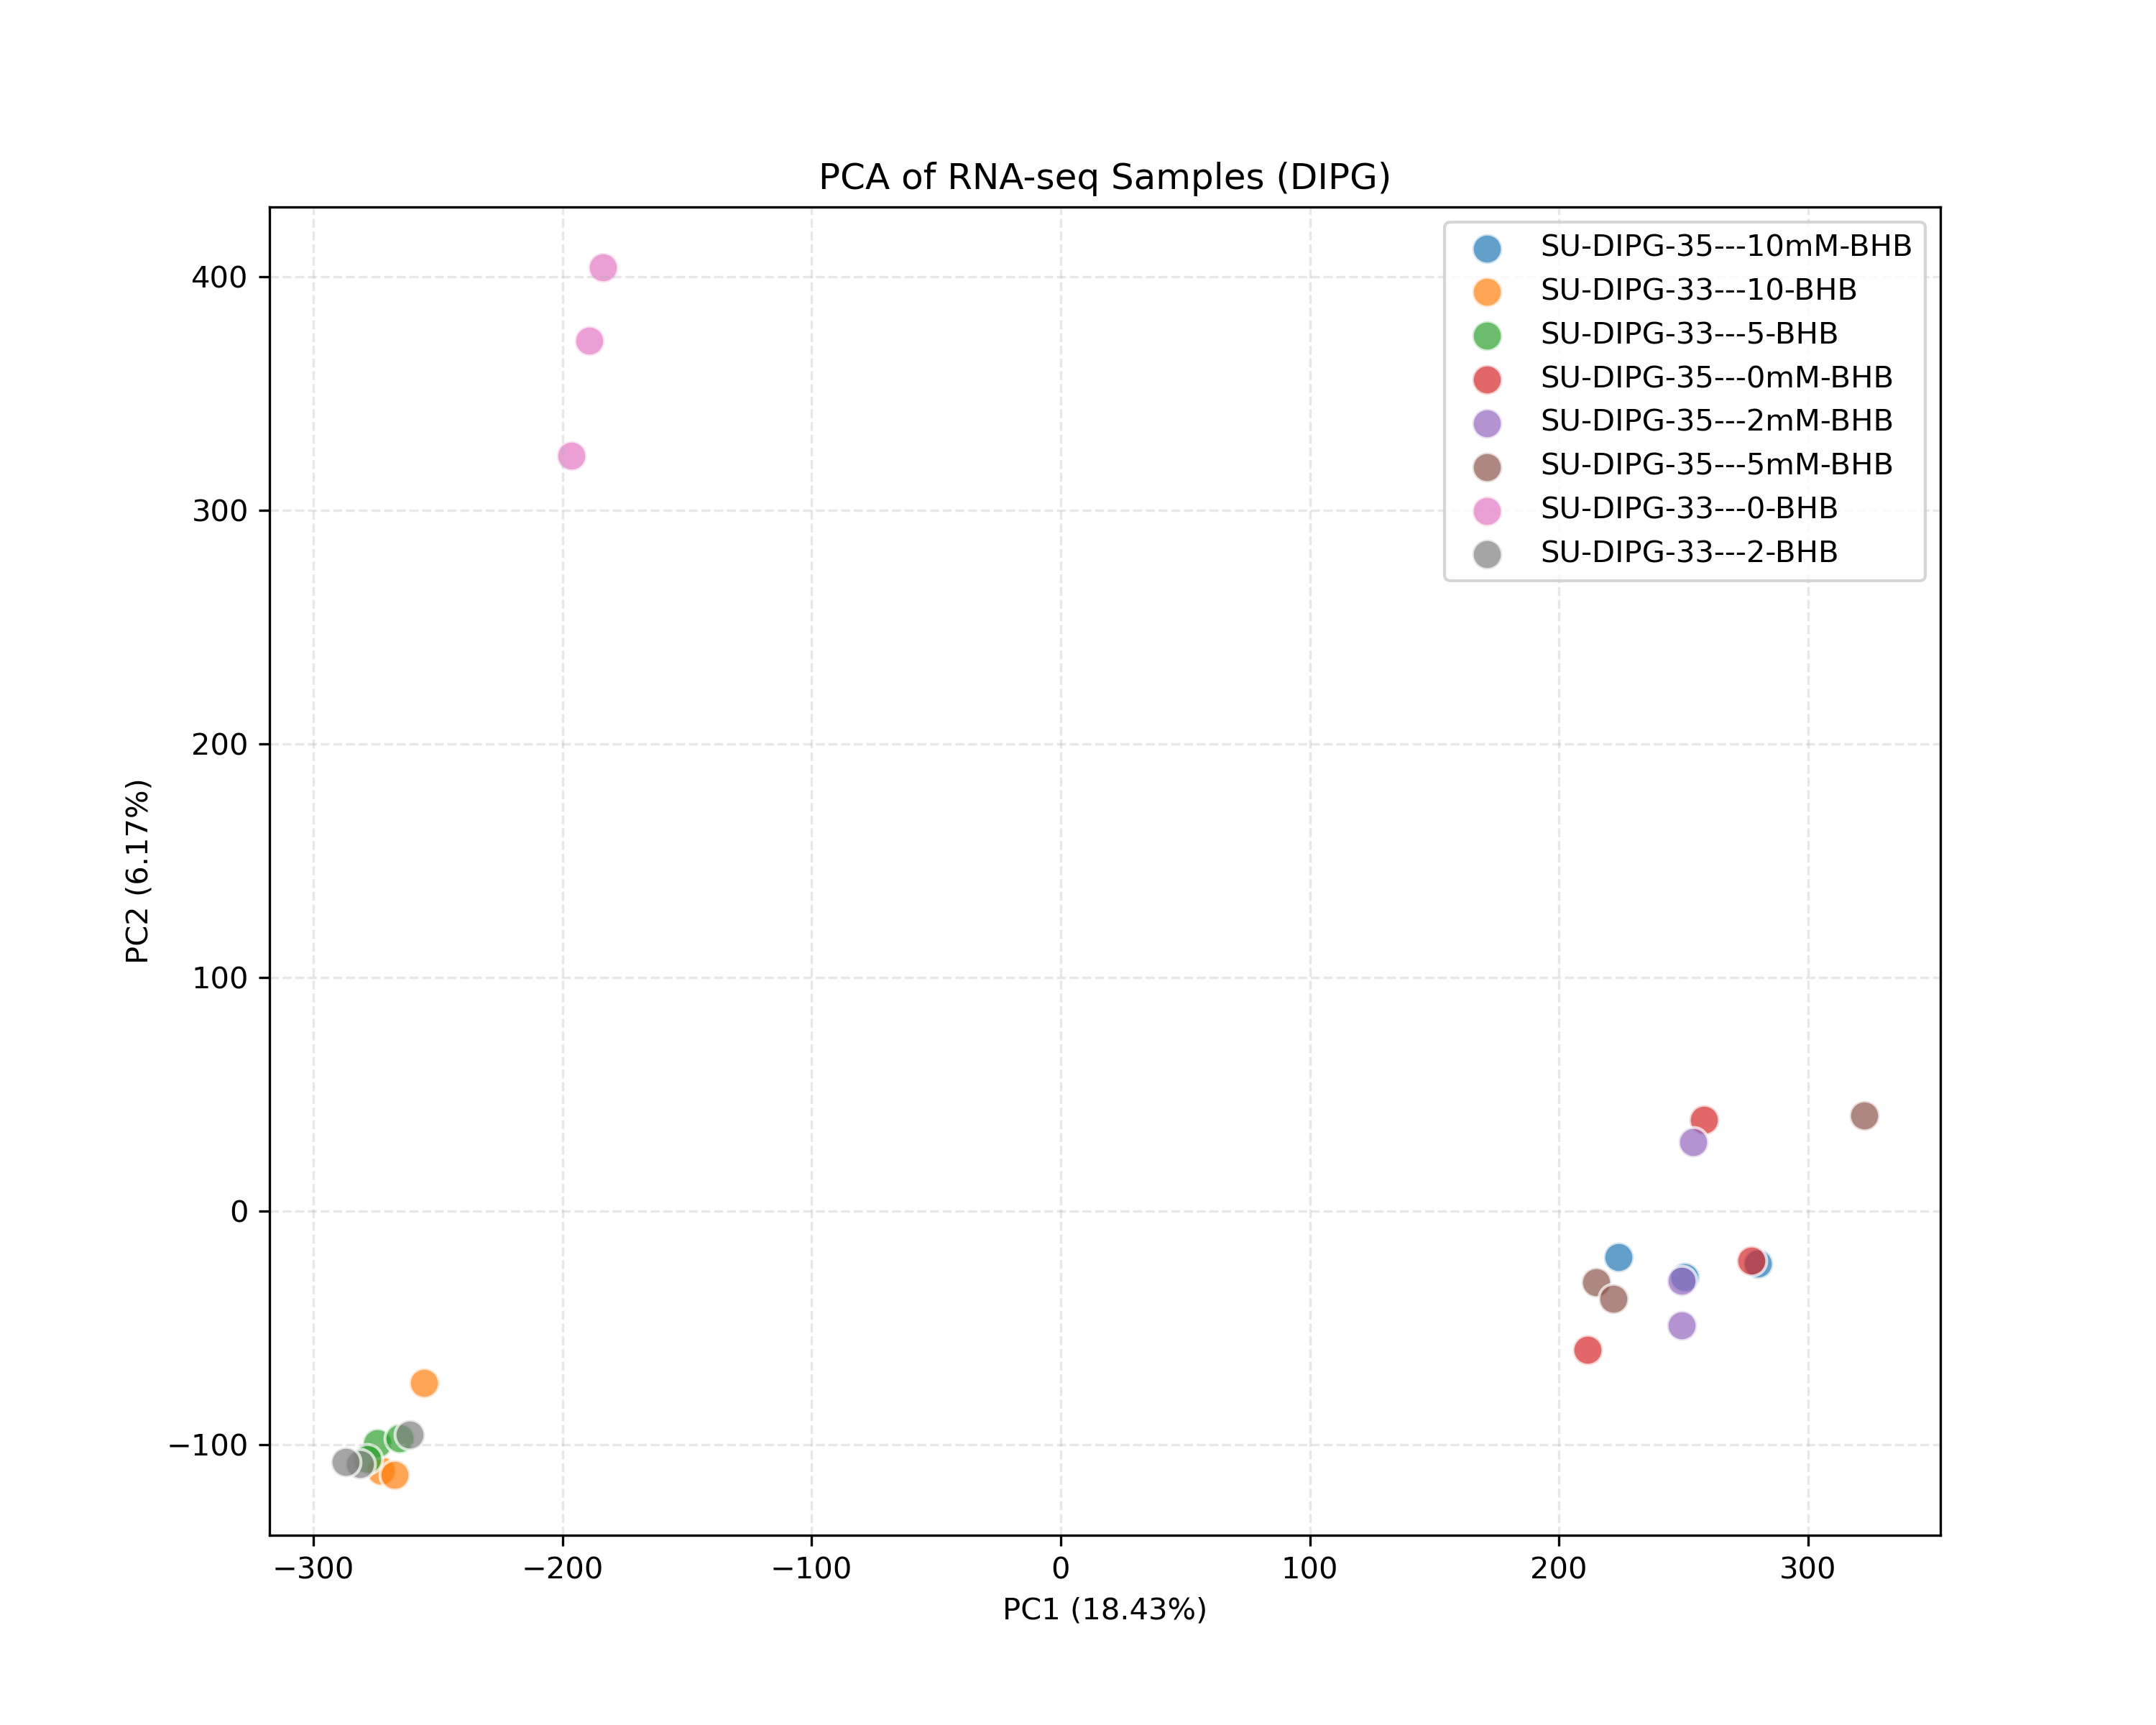
Initial quality control of RNA-seq samples, evaluating sample similarities (PCA) and transcription coverage (detected genes).
⚙️ Pipeline Logic (src/mapping_pipeline.py):
- Resource Setup: Downloads the reference transcriptome from GENCODE, pulls the Salmon Apptainer image, and builds a Salmon index (if not already present).
- Sample Discovery: Scans
fastq_data/for paired-end_R1.fastq.gzand matching_R2.fastq.gzsequence files, grouping them as distinct biological replicates. - Execution Guard (tmux): Spawns a background
tmuxsession (rnaseq_<organism>) to protect mapping against potential network disconnects or process interruptions. - Salmon Quantification: Executes
salmon quantwithin the container, validating mappings and correcting for GC bias (--validateMappings --gcBias). - Aggregation: Collects individual transcript count and TPM values from Salmon
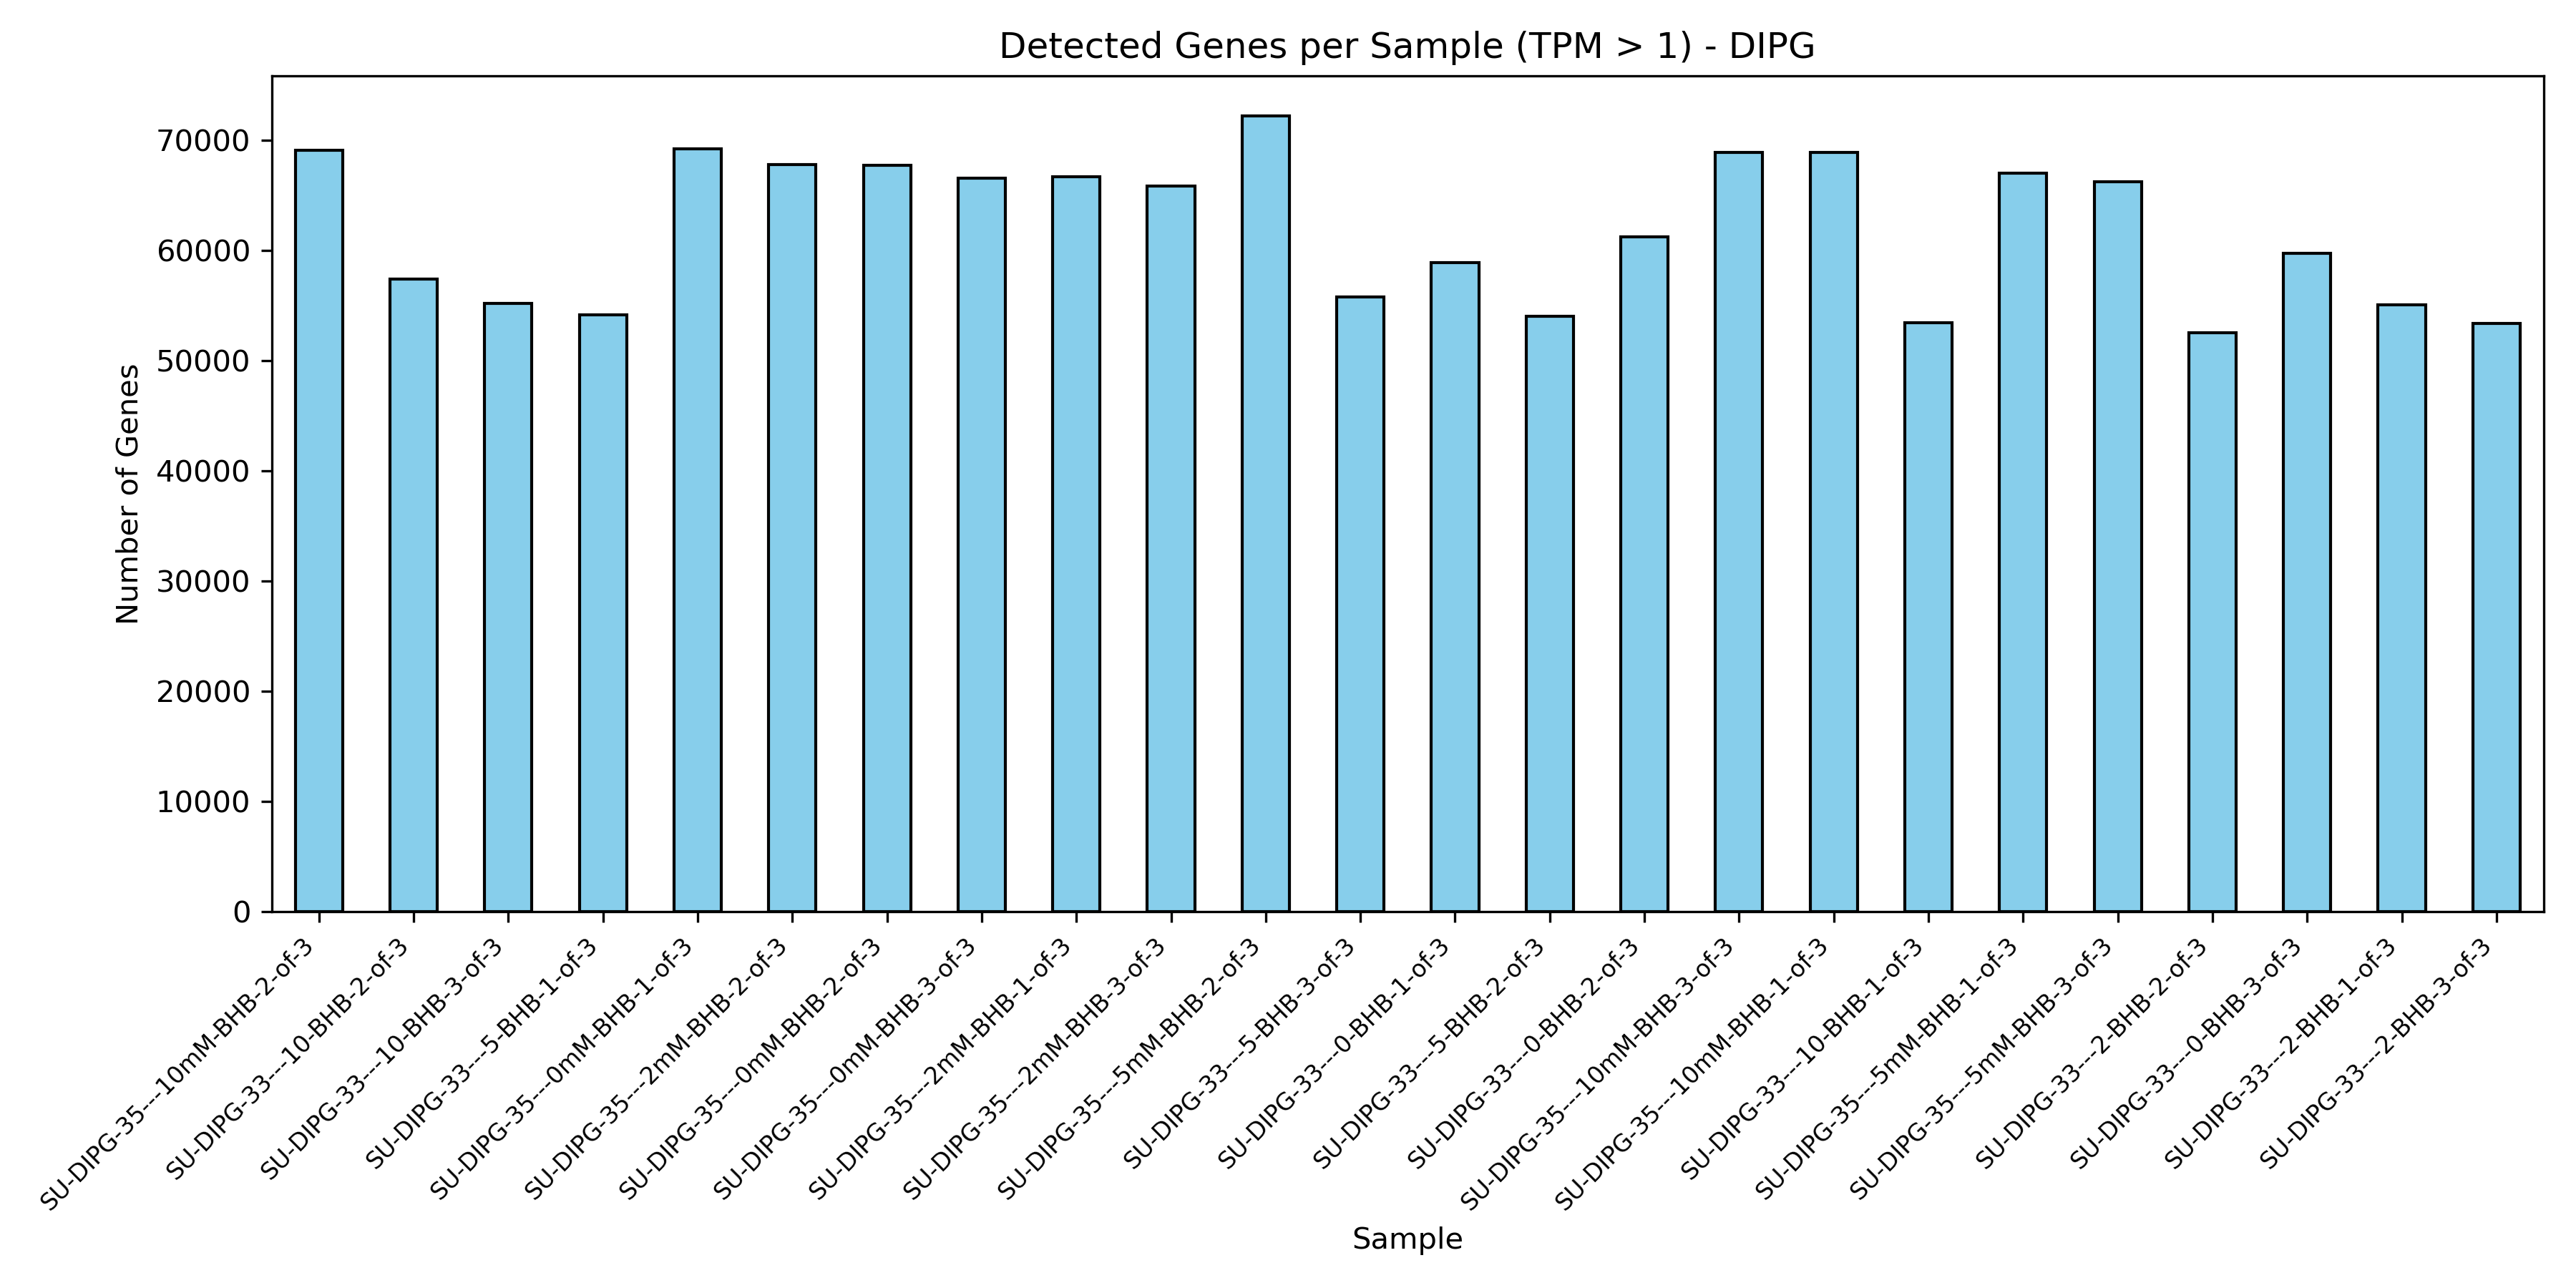
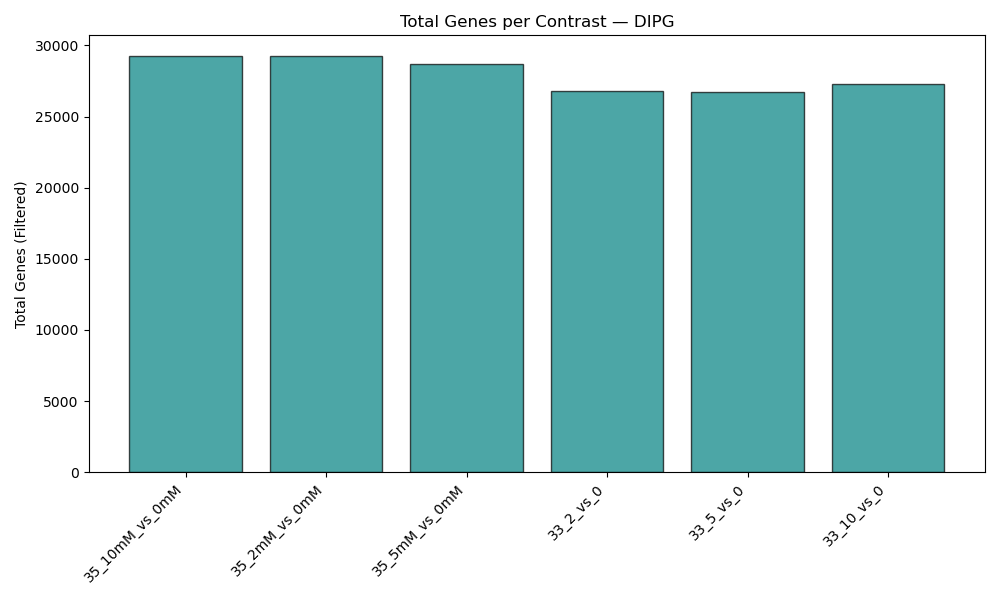
quant.sfoutput directories into combined matrices. - QC Visualizations: Generates sample PCA plot (PC1 vs PC2) on log2-transformed TPM data, and detected gene count barplot (genes with TPM > 1).
💡 How to Interpret QC Plots:
- PCA plot: Shows how samples cluster together. Replicates of the same condition (e.g., 2mM biological replicates) should cluster tightly. The distance between different doses shows the transcriptomic impact of BHB treatment. If cell lines are mixed, they should separate along the primary axis (PC1), showing baseline differences.
- Detected Genes plot: Shows the number of genes successfully quantified (TPM > 1) per sample. Sudden drops in specific samples suggest low sequencing depth or library prep failures.
Mapped Gene Counts
Salmon transcript-level quantification mapping and gene-level count matrix aggregation.
⚙️ Pipeline Logic (src/utils.py & src/mapping_pipeline.py):
- ID Parsing (
parse_gene_ids): Parses Gencode pipe-delimited header rows (e.g.,ENST|ENSG|...|Symbol|...) to map raw indices to Ensembl Gene IDs, retrieve gene symbols, and capture biotypes. - Isoform Aggregation (
aggregate_counts,load_and_aggregate_counts): Sums transcript-level raw counts or TPMs grouping them by Ensembl Gene ID or mapped Gene Symbol to obtain gene-level expression tables.
Differential Gene Expression (DGE)
Pairwise Differential Gene Expression analysis comparing BHB-treated cells vs. untreated control (0mM) using PyDESeq2.
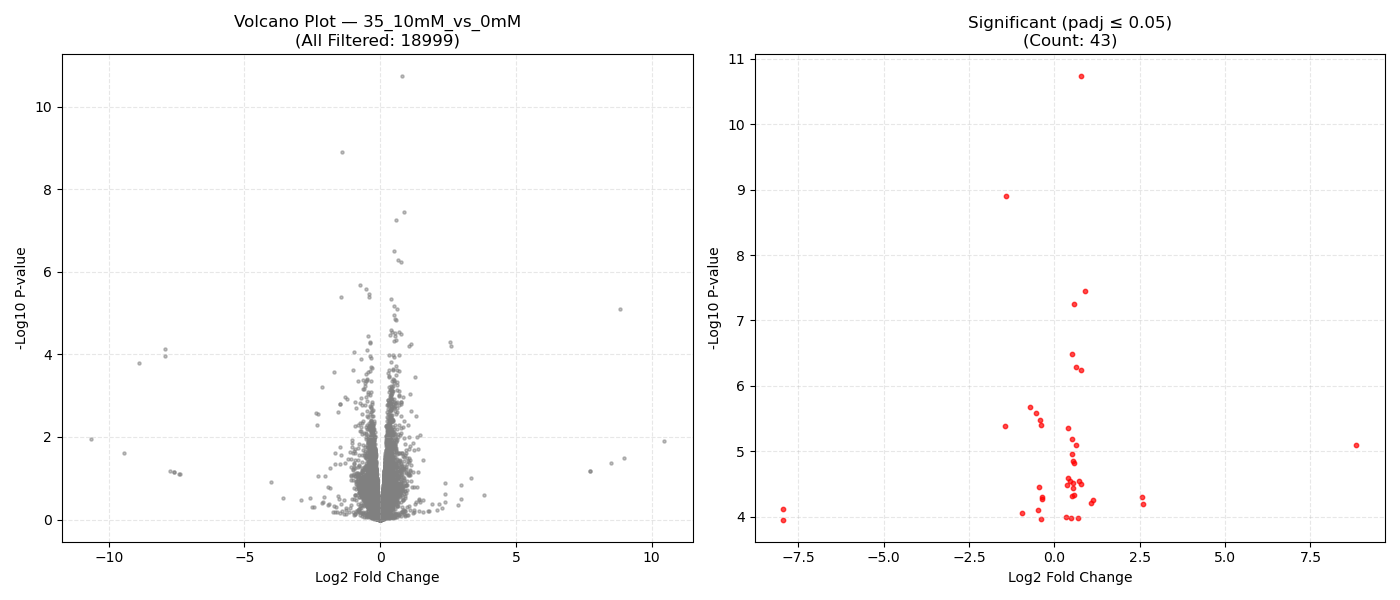
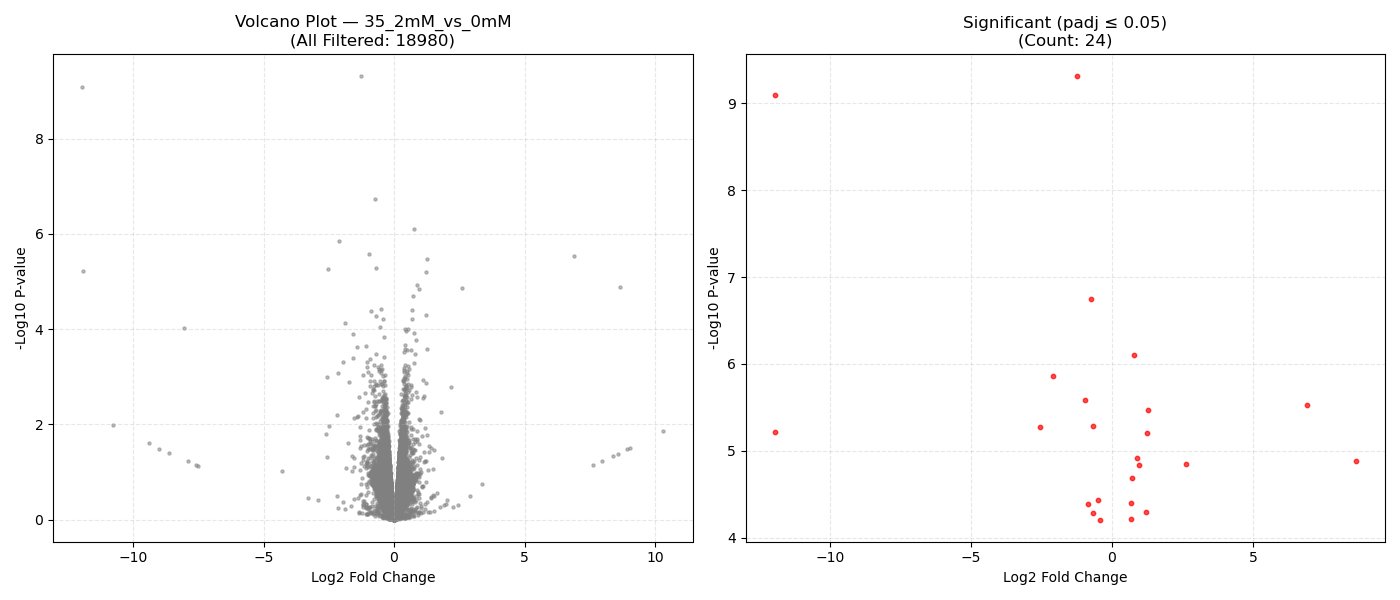
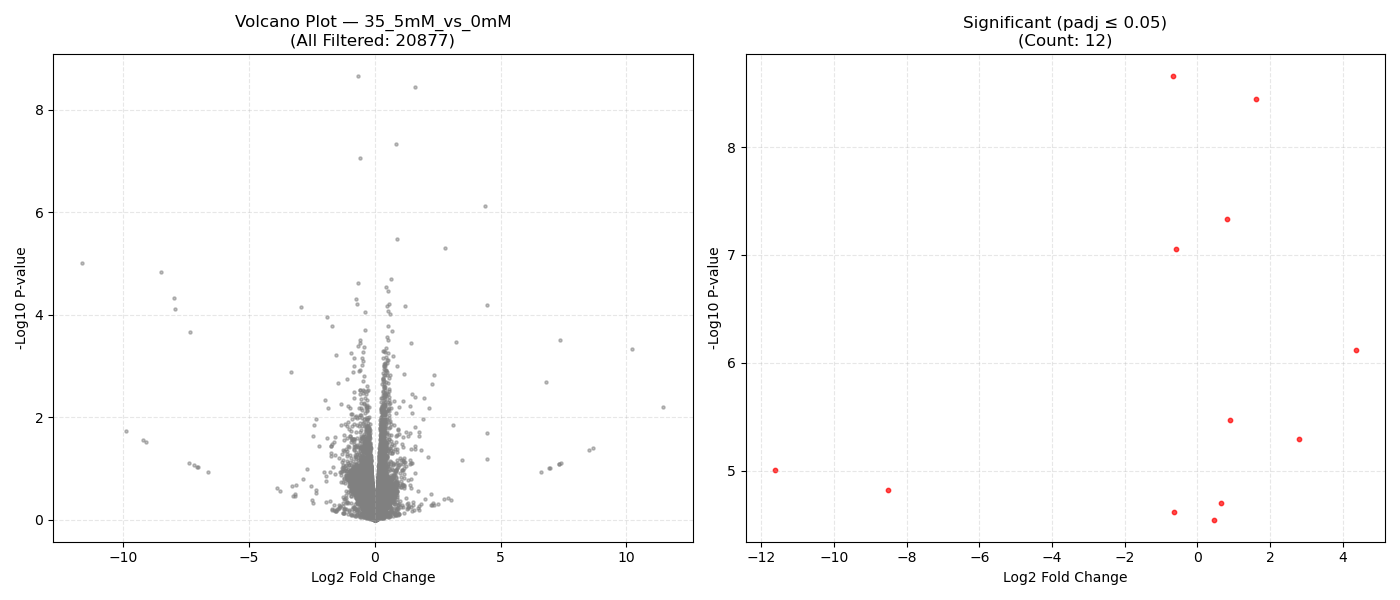
Contrast Volcano Plots

⚙️ Pipeline Logic (src/run_dge.py):
- Isoform Aggregation: Extracts Ensembl Gene IDs from pipe-delimited raw row headers and aggregates isoform transcript counts to gene level by summing.
- Gene Pruning: Filters out low-abundance genes with a total count sum ≤ 10 across all samples of the contrast.
- Two-Pass Annotation: Employs
GeneAnnotator(combining local caching, fast MyGene bulk queries, and concurrent Ensembl REST fallback) to fetch gene symbols, biotypes, and functional descriptions. - Statistical Fitting: Initialises
DeseqDataSet(design='~Condition') and runs the DESeq2 pipeline (normalizes counts, estimates dispersion, fits negative binomial GLM, and refits outliers using Cook's distance). - Wald Test: Executes
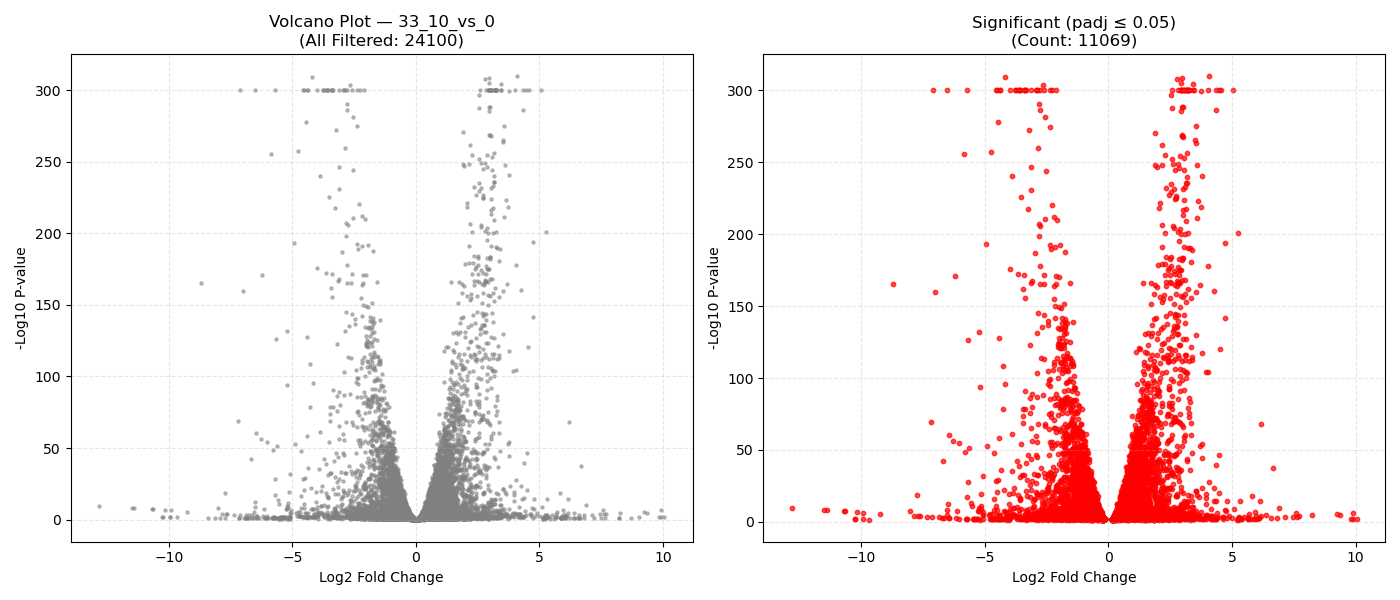
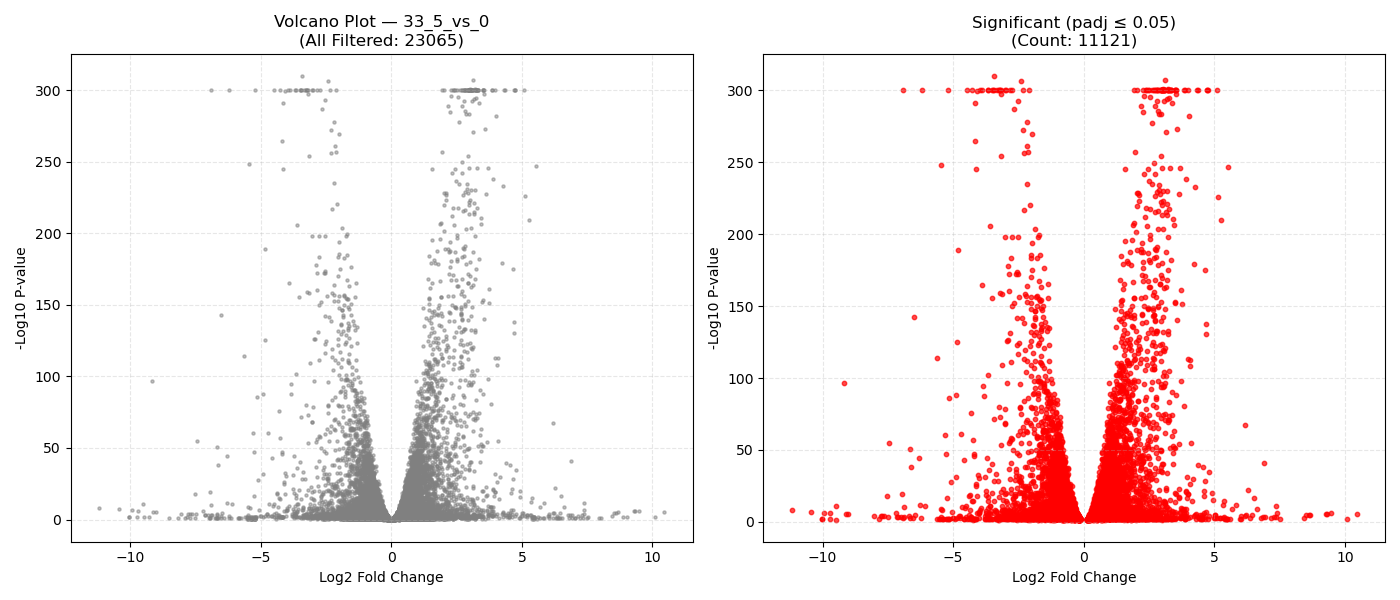
DeseqStatsto perform pairwise Wald tests, computing Log2 Fold Changes, raw p-values, and BH-adjusted p-values (padj). - Export & Volcano Plots: Saves results to DGE CSVs. Generates 1x2 volcano plots showing all genes and significant genes (
padj ≤ 0.05). Falls back to Log2FC histograms if replicates are insufficient ($N < 3$).
💡 How to Interpret DGE & Volcano Plots:
- Volcano Plot Axes: X-axis represents the magnitude of shift (Log2 Fold Change). Y-axis shows statistical significance (-Log10 P-value). Genes in the top-right and top-left corners represent highly significant, strongly dysregulated genes.
- P-adjusted (padj): Always use the adjusted P-value (FDR) column for downstream targets. An adjusted P-value threshold of ≤ 0.05 guarantees that only 5% of your selected genes are false positives.
- Histogram Fallback: If the number of replicates is insufficient for DESeq2 dispersion estimation, the pipeline automatically falls back to plotting Log2FC histograms. In this scenario, we cannot perform significance testing.
Dose-Response Trend Clustering
Performs K-Means clustering on the z-scored average expressions of differentially expressed genes across BHB doses (0mM → 2mM → 5mM → 10mM) and identifies functional pathway enrichment (Enrichr) for each trend profile.
Unified Response Trends & Pathways (K=8)
Dynamic Gene Cluster Dose-Response Viewer
⚙️ Pipeline Logic for Unified Sample Comparison (src/dose_response_clustering.py):
To analyze how genes adapt across treatment doses without isolating the cell lines, we utilize a unified 8-dimensional clustering space. The mathematical workflow is as follows:
-
Compilation of Union DEG Set:
First, we identify significant differentially expressed genes (padj ≤ 0.05) in any contrast of Cell Line A or Cell Line B. Taking the union of these genes ensures that any transcript exhibiting response dynamics in at least one cellular background is included. -
Independent Baseline Standardization (Row Z-scoring):
To isolate the relative shape (trend) of the response curve from static baseline abundance differences (since one cell line may naturally express a gene at a much higher absolute level than the other), the 4-point dose profile (0mM, 2mM, 5mM, 10mM) is averaged across replicates and row z-scored independently for each cell line: $$\mu_{\text{line}} = \frac{1}{4}\sum_{d} TPM_{line, d},\quad \sigma_{\text{line}} = \text{std}(TPM_{line})$$ $$Z_{line, d} = \frac{TPM_{line, d} - \mu_{\text{line}}}{\sigma_{\text{line}}}$$ This maps both profiles to a comparable scale with a mean of 0 and standard deviation of 1. -
8-Dimensional Trajectory Concatenation:
For each gene, we concatenate the 4-point standardized profile of Cell Line A and the 4-point standardized profile of Cell Line B into a single 8-dimensional feature vector: $$\mathbf{V}_{gene} = [Z_{A,0}, Z_{A,2}, Z_{A,5}, Z_{A,10}, Z_{B,0}, Z_{B,2}, Z_{B,5}, Z_{B,10}]$$ -
Joint K-Means Clustering:
K-Means clustering (using $K=8$ clusters) is performed directly on this 8-dimensional space. By clustering in 8D, the algorithm groups genes that share:- Shared Concordant Trends: E.g., genes that show a dose-dependent increase in both cell lines.
- Divergent cell-line-specific Trends: E.g., genes that increase in Cell Line A but decrease or remain flat in Cell Line B.
-
Pathway Enrichment (Enrichr):
The genes assigned to each cluster are submitted to the Enrichr API (gseapy.enrichr) to detect biological pathways (GO and KEGG) that correspond to these joint response patterns.
💡 How to Interpret Dose-Response Trends:
- The Role of Z-scores (Relative Fluctuations):
Clustering is performed on row-standardized z-scores, which means genes are grouped by their relative fluctuation patterns (shape and direction of the response curve) rather than their raw abundance.
- Removing baseline offsets: A gene expressed at 1000 TPM and another at 10 TPM that both increase 2-fold across doses will be grouped together because their standardized shapes are identical.
- Removing scale differences: A gene showing a massive response (increasing by 30 units) and one showing a subtle response (increasing by 3 units) will cluster together as long as their response trajectories are linear and parallel.
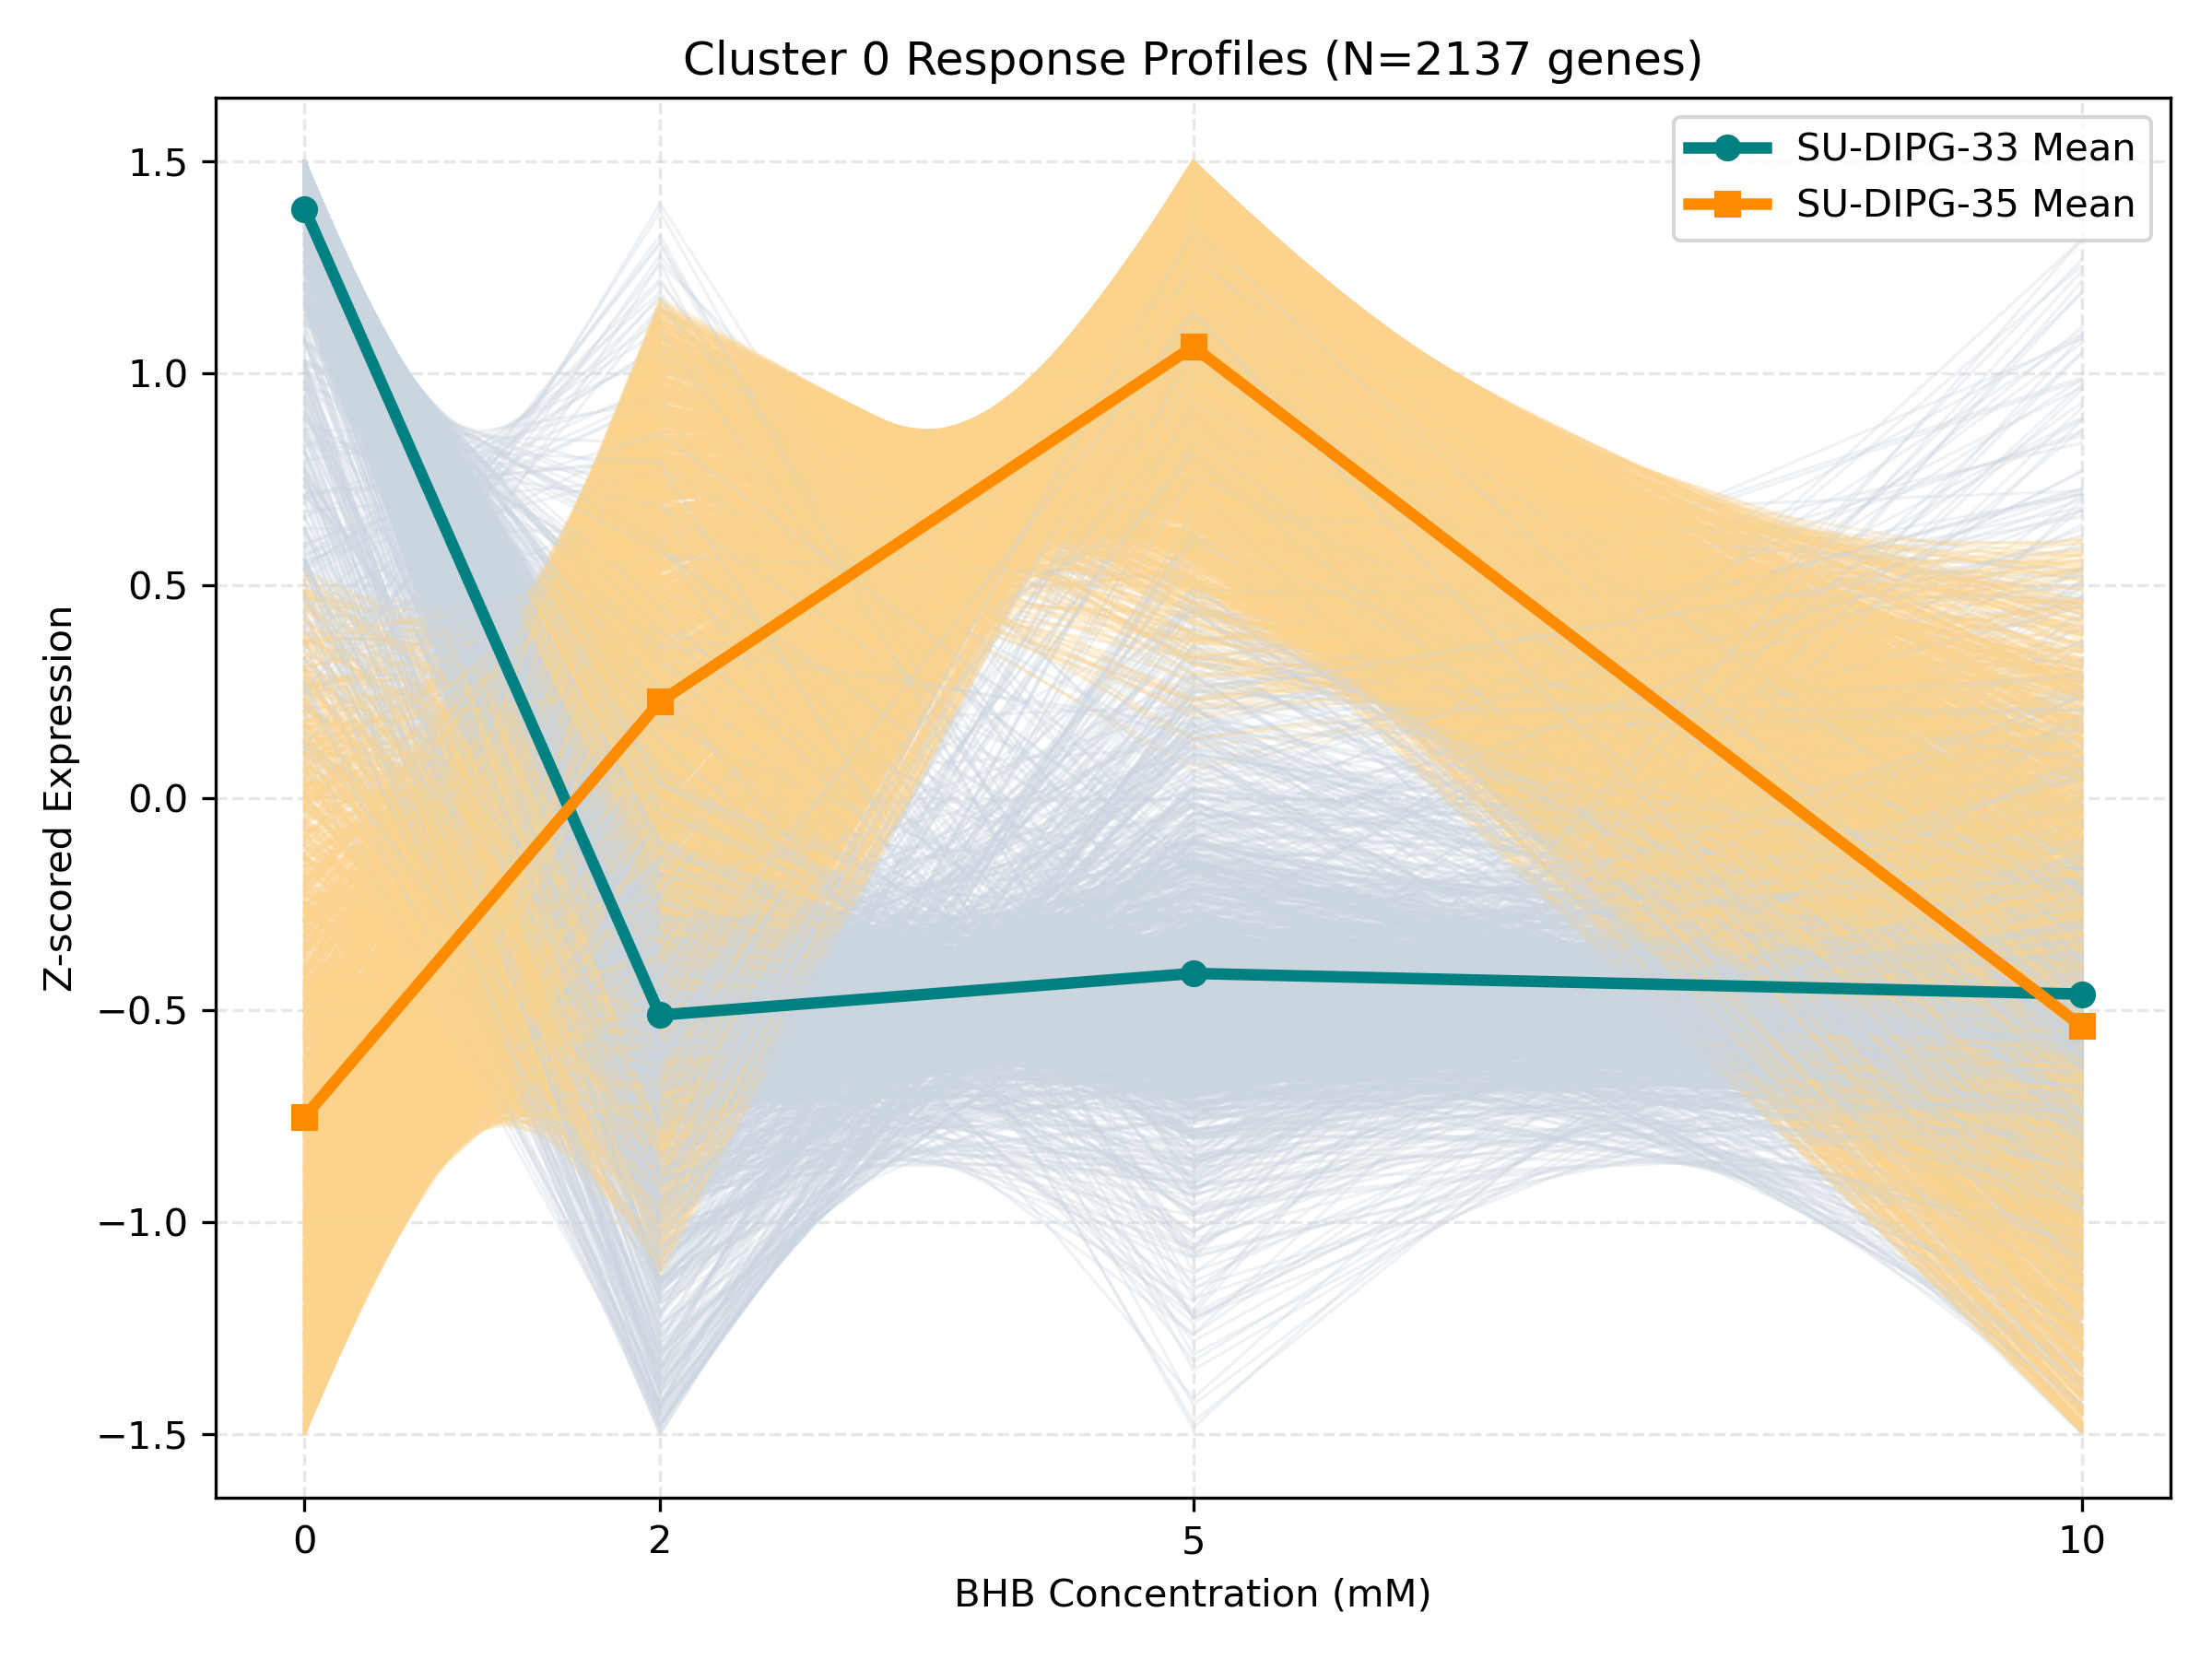
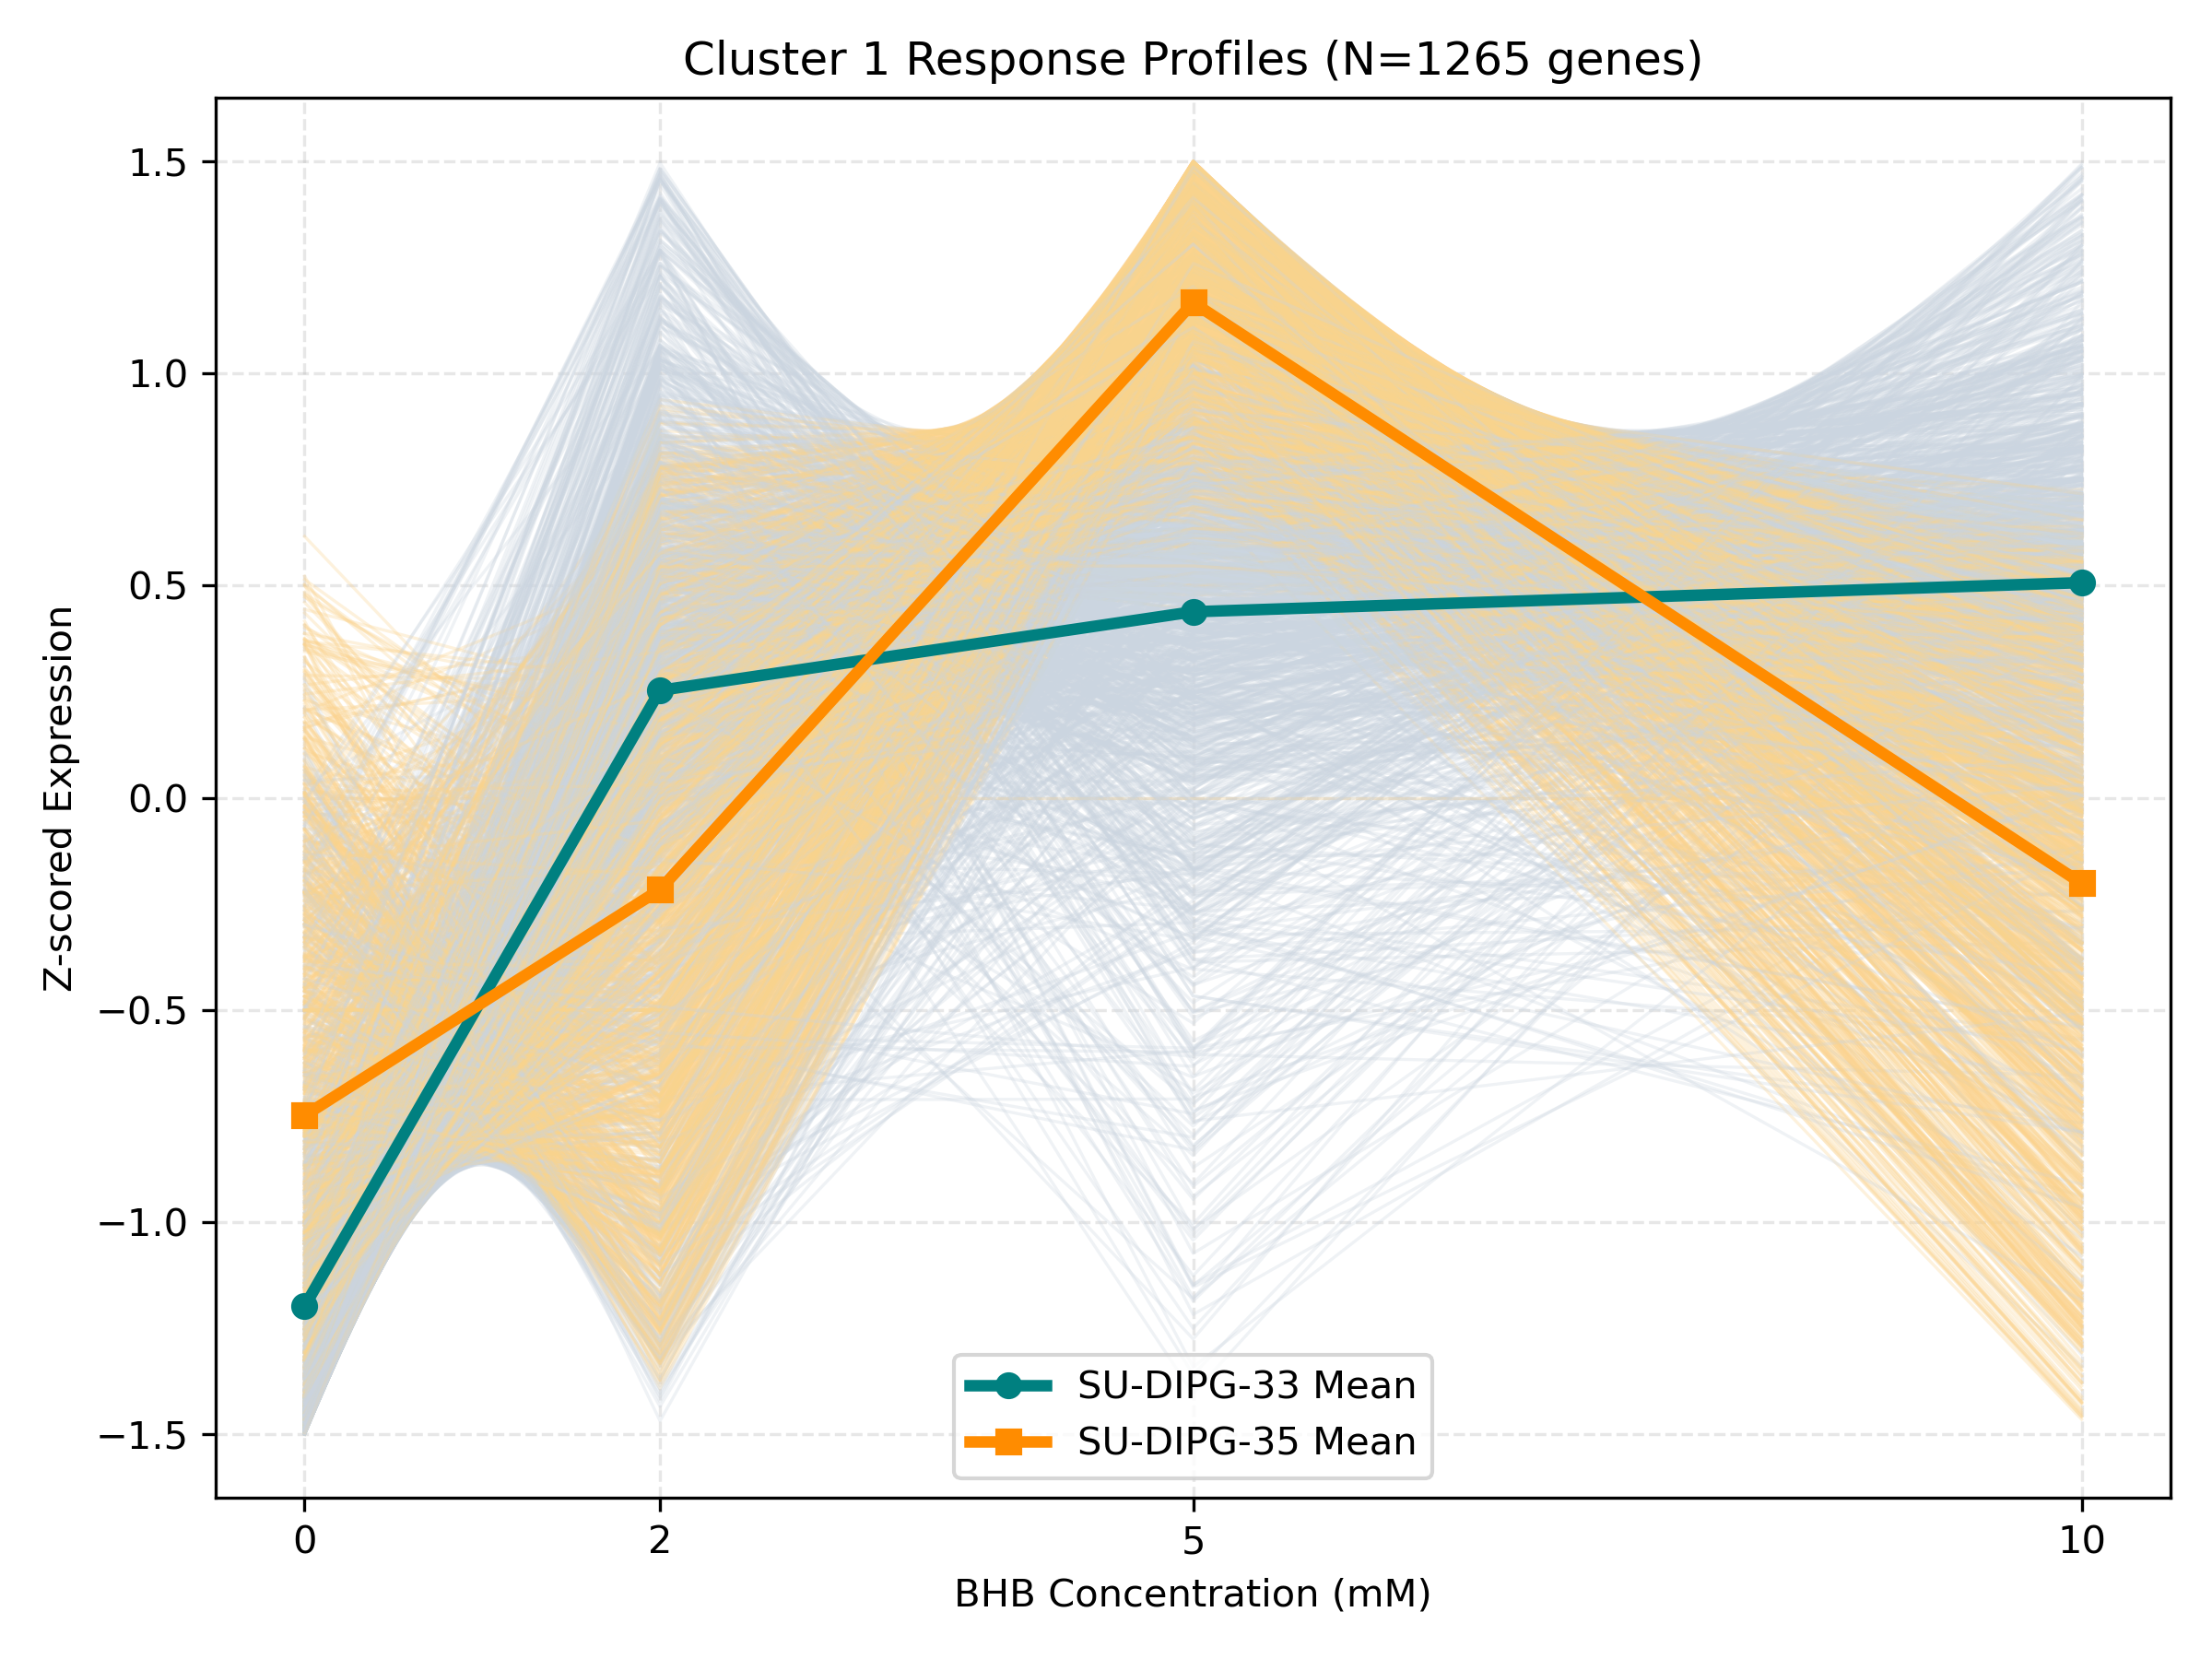
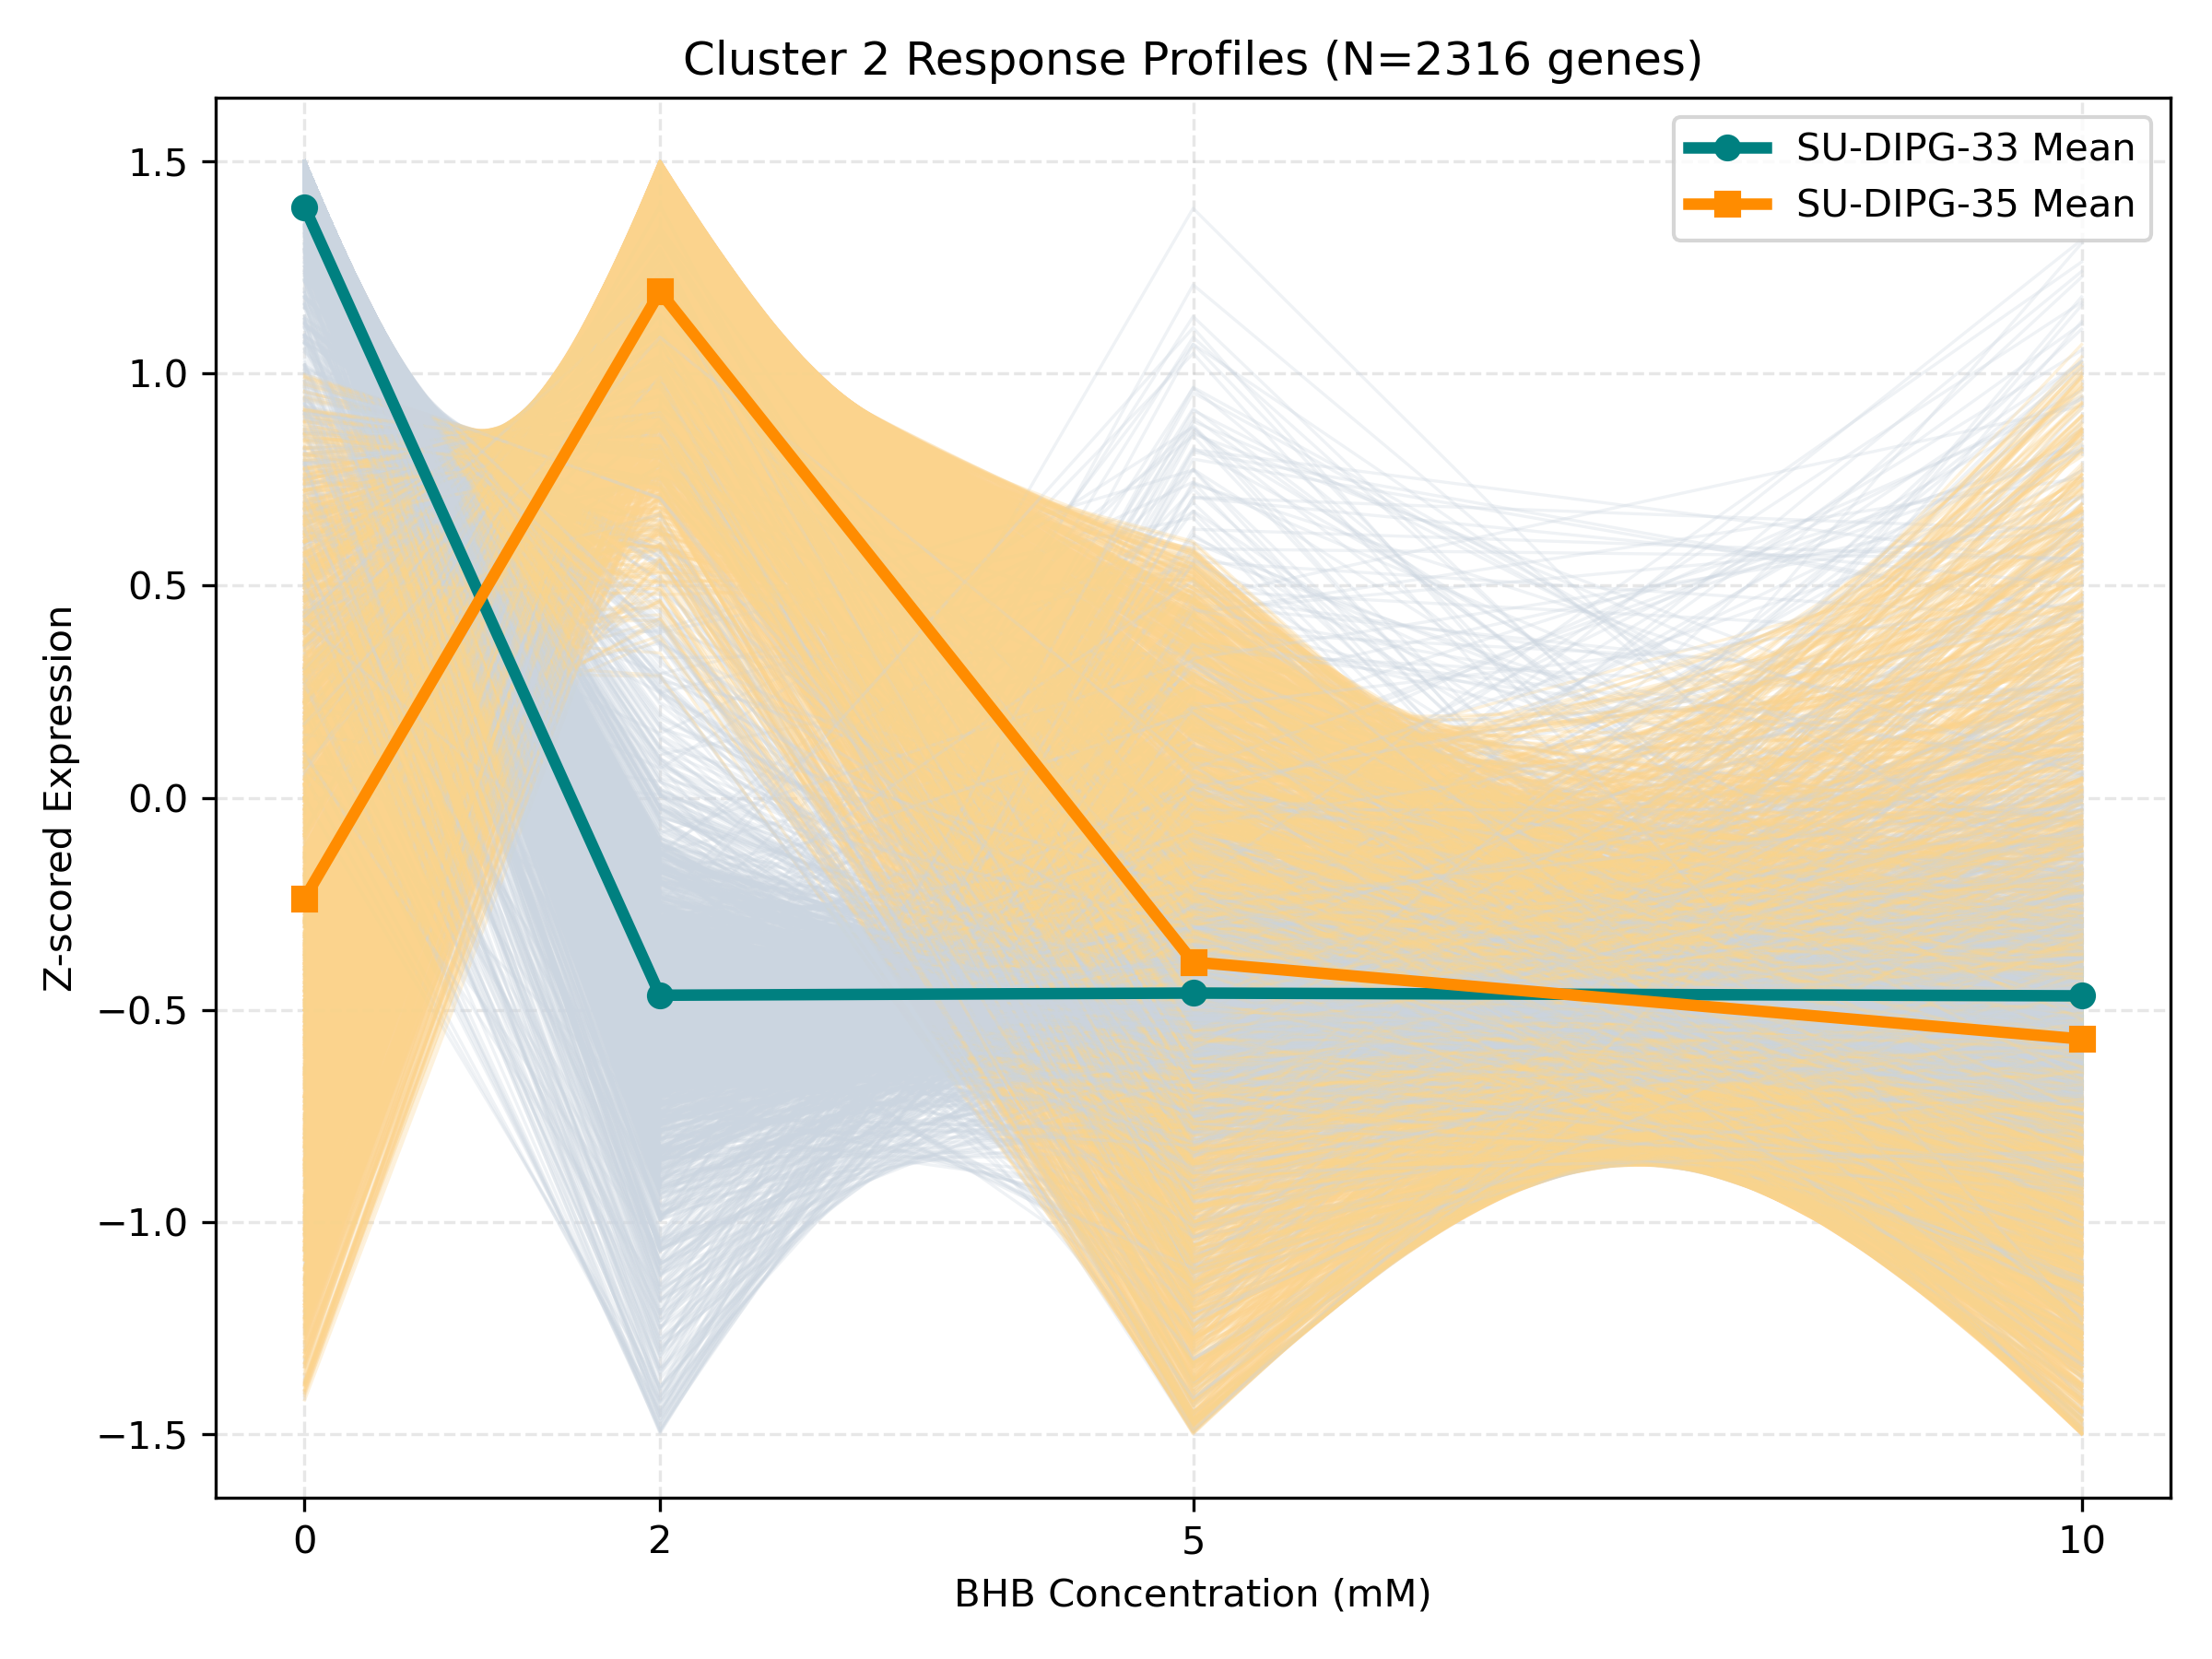
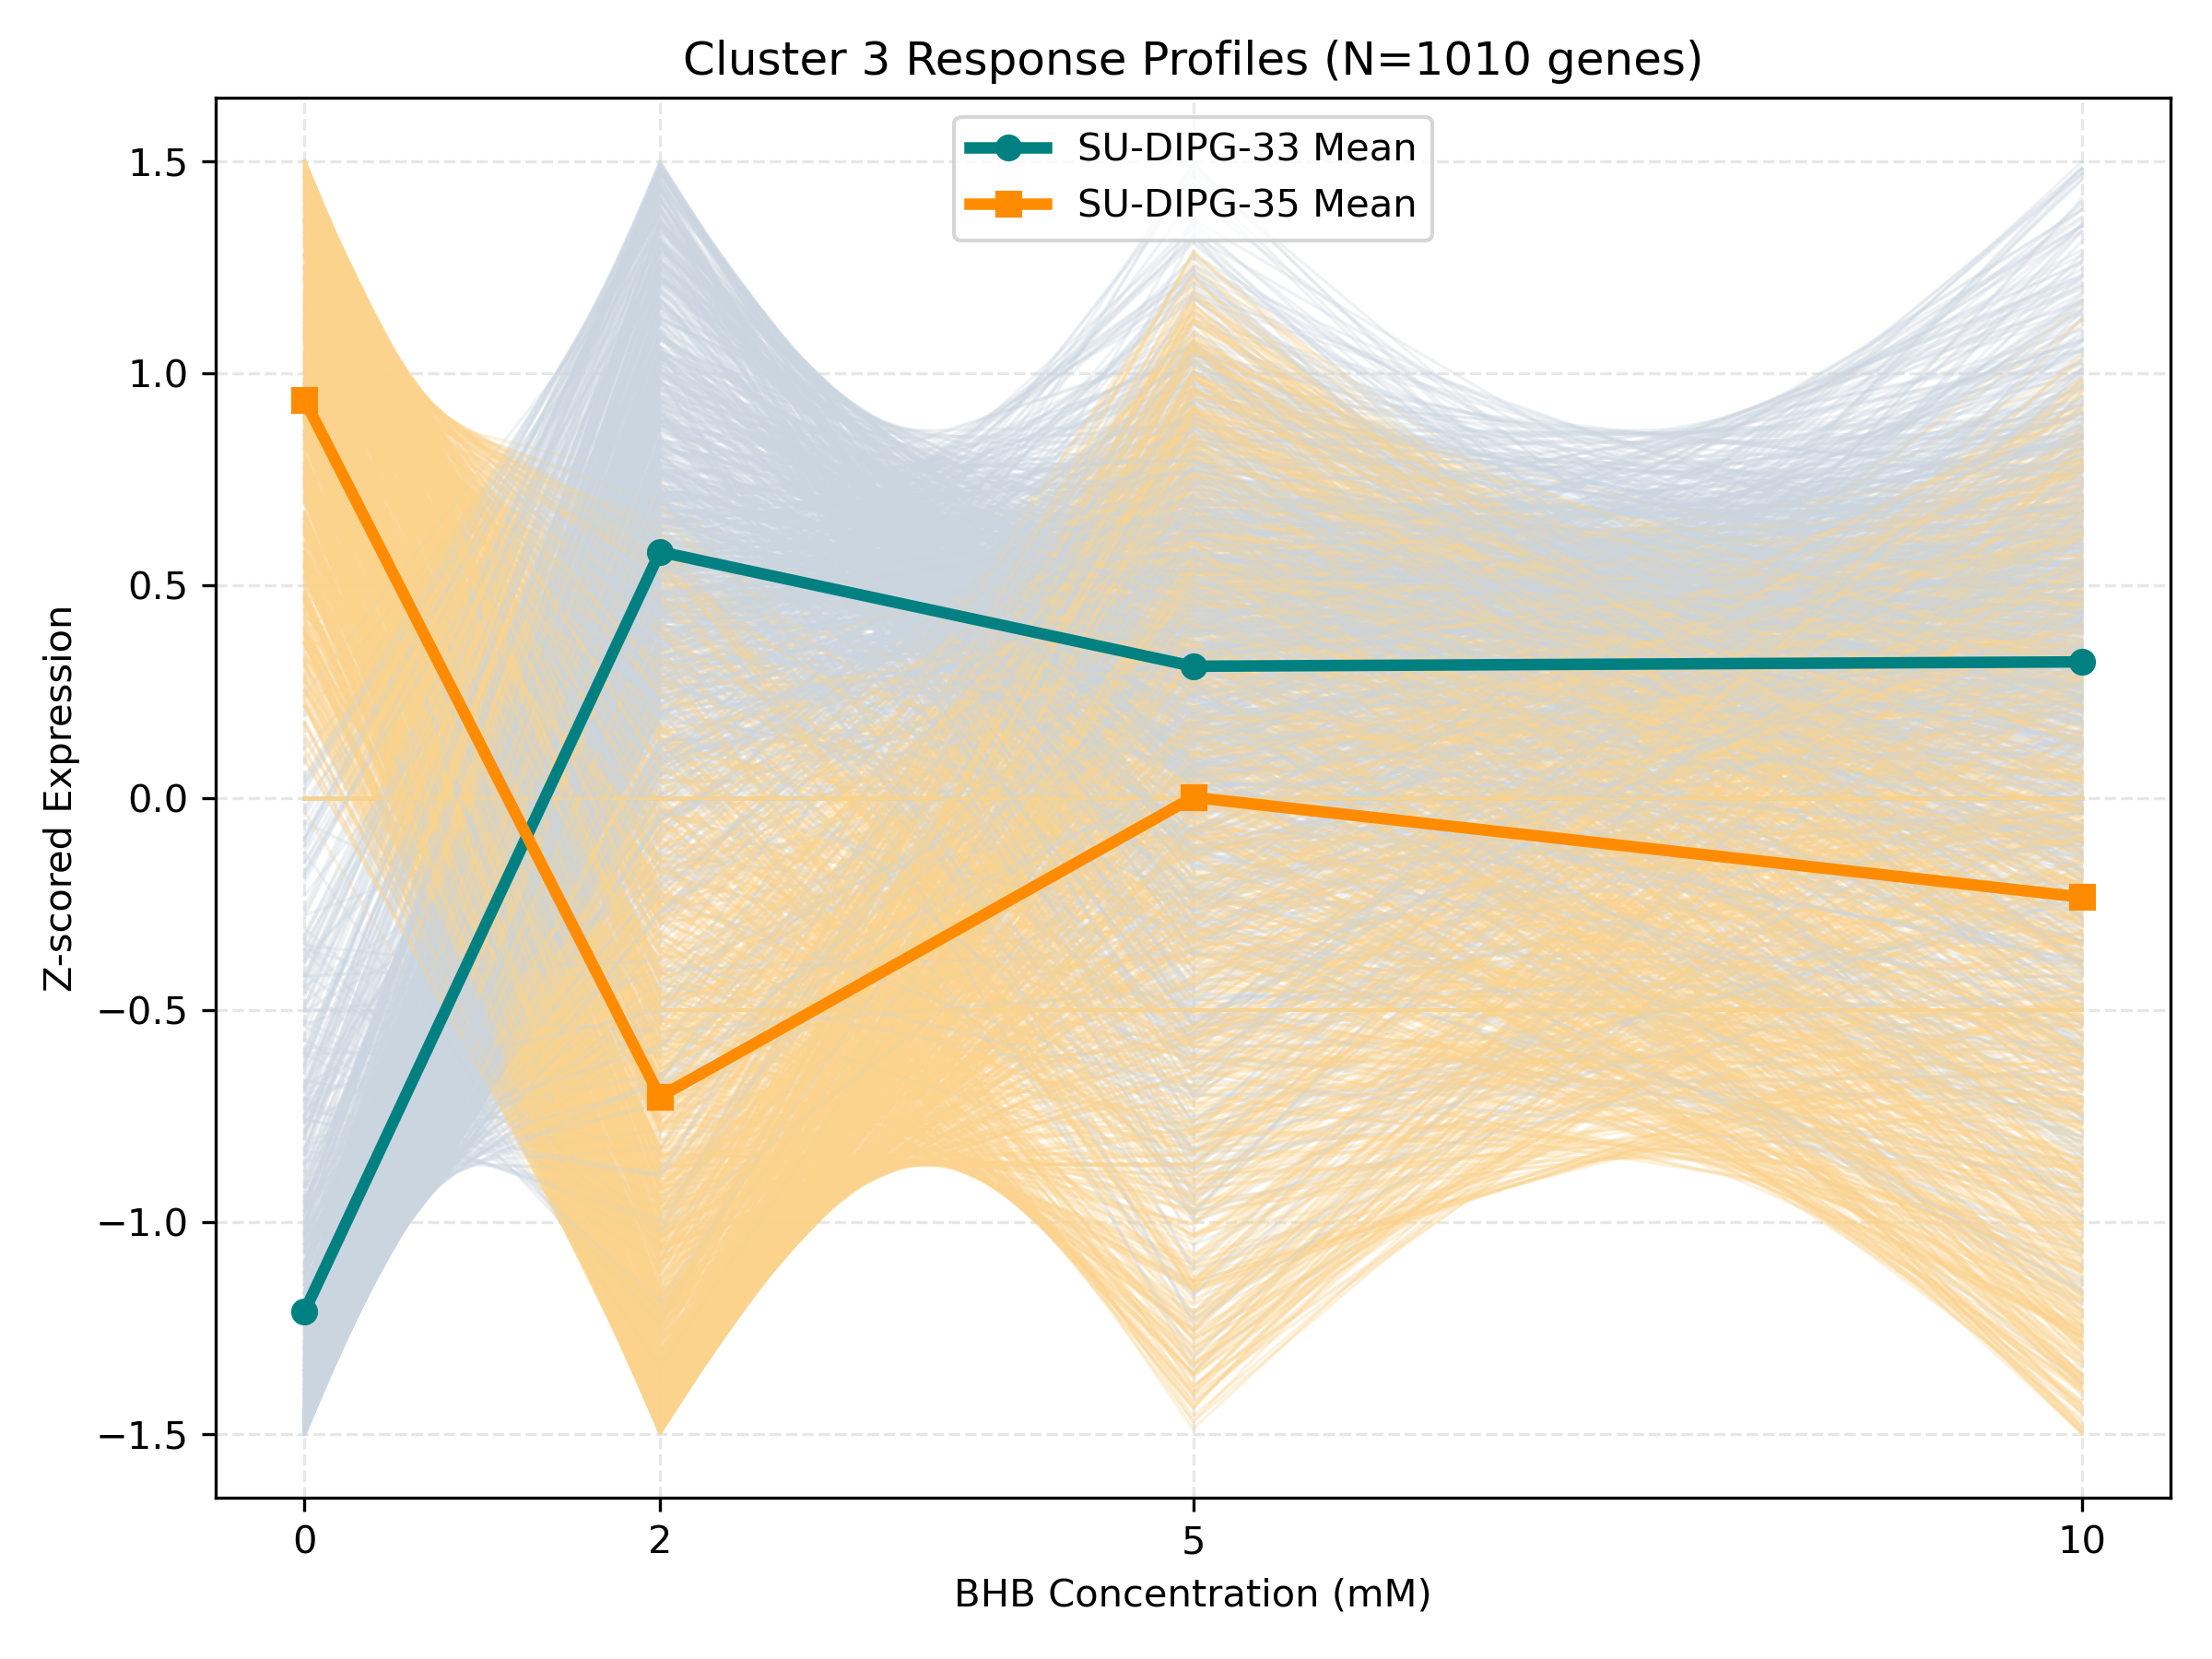
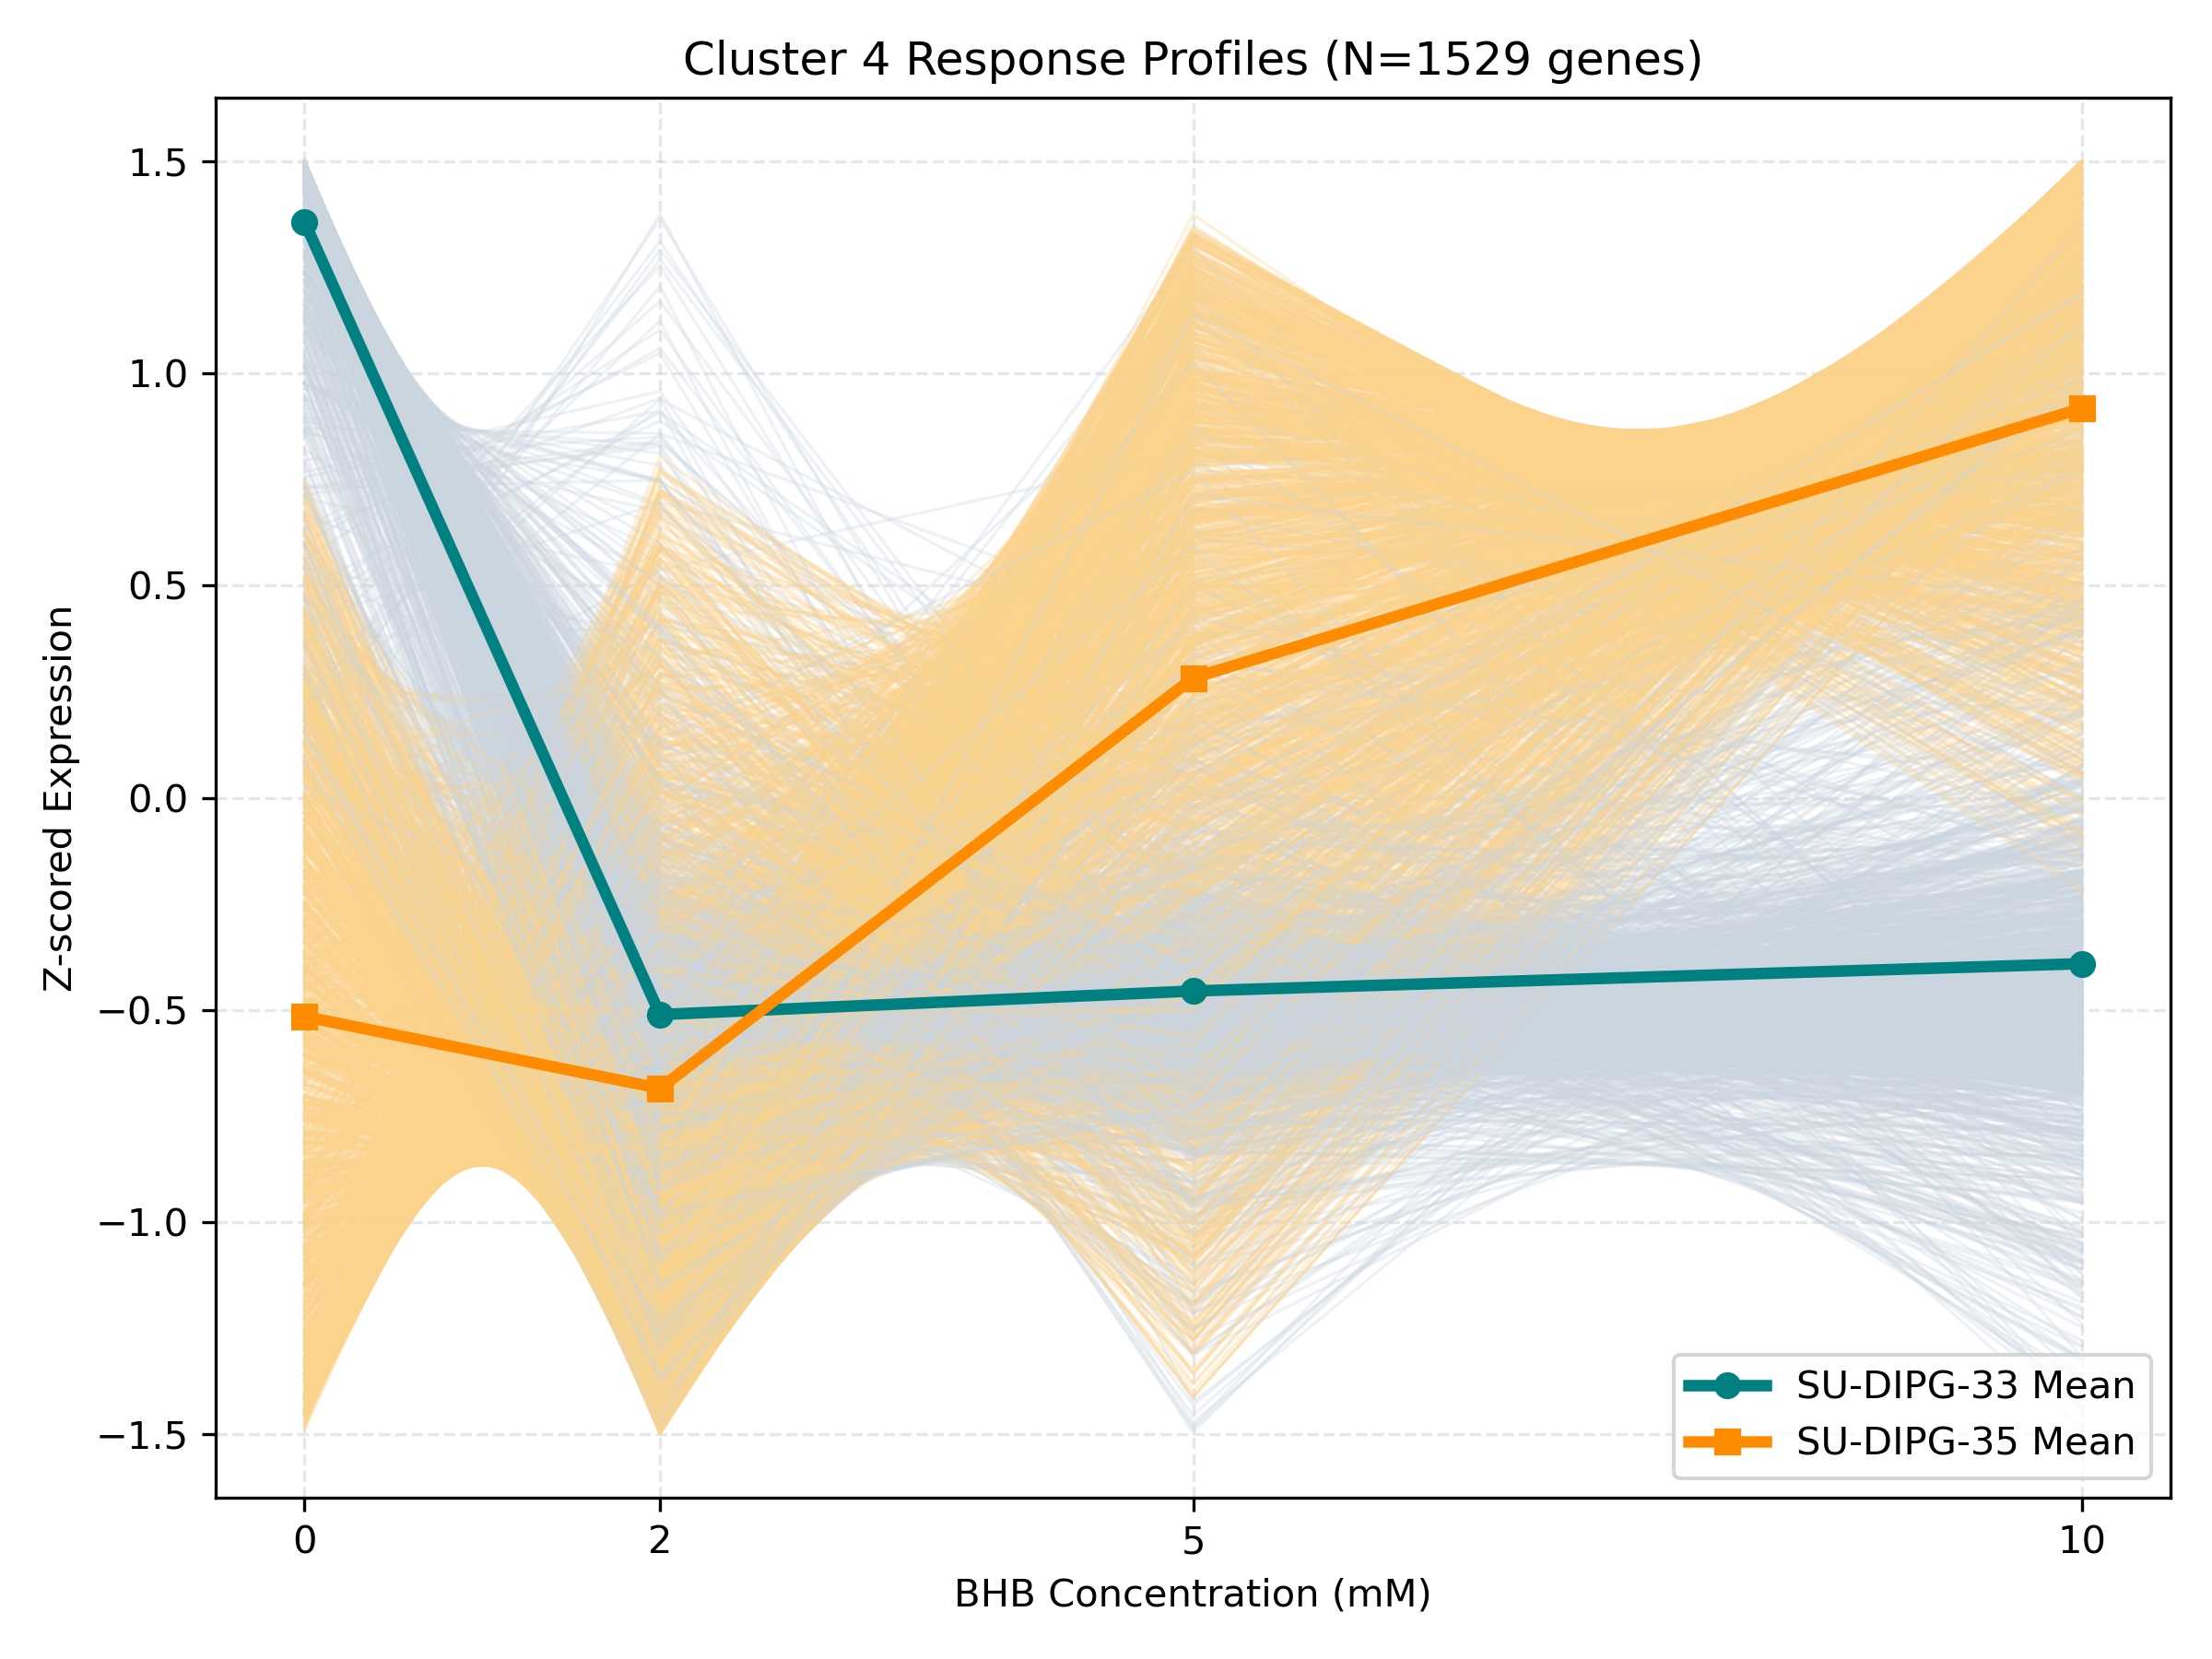
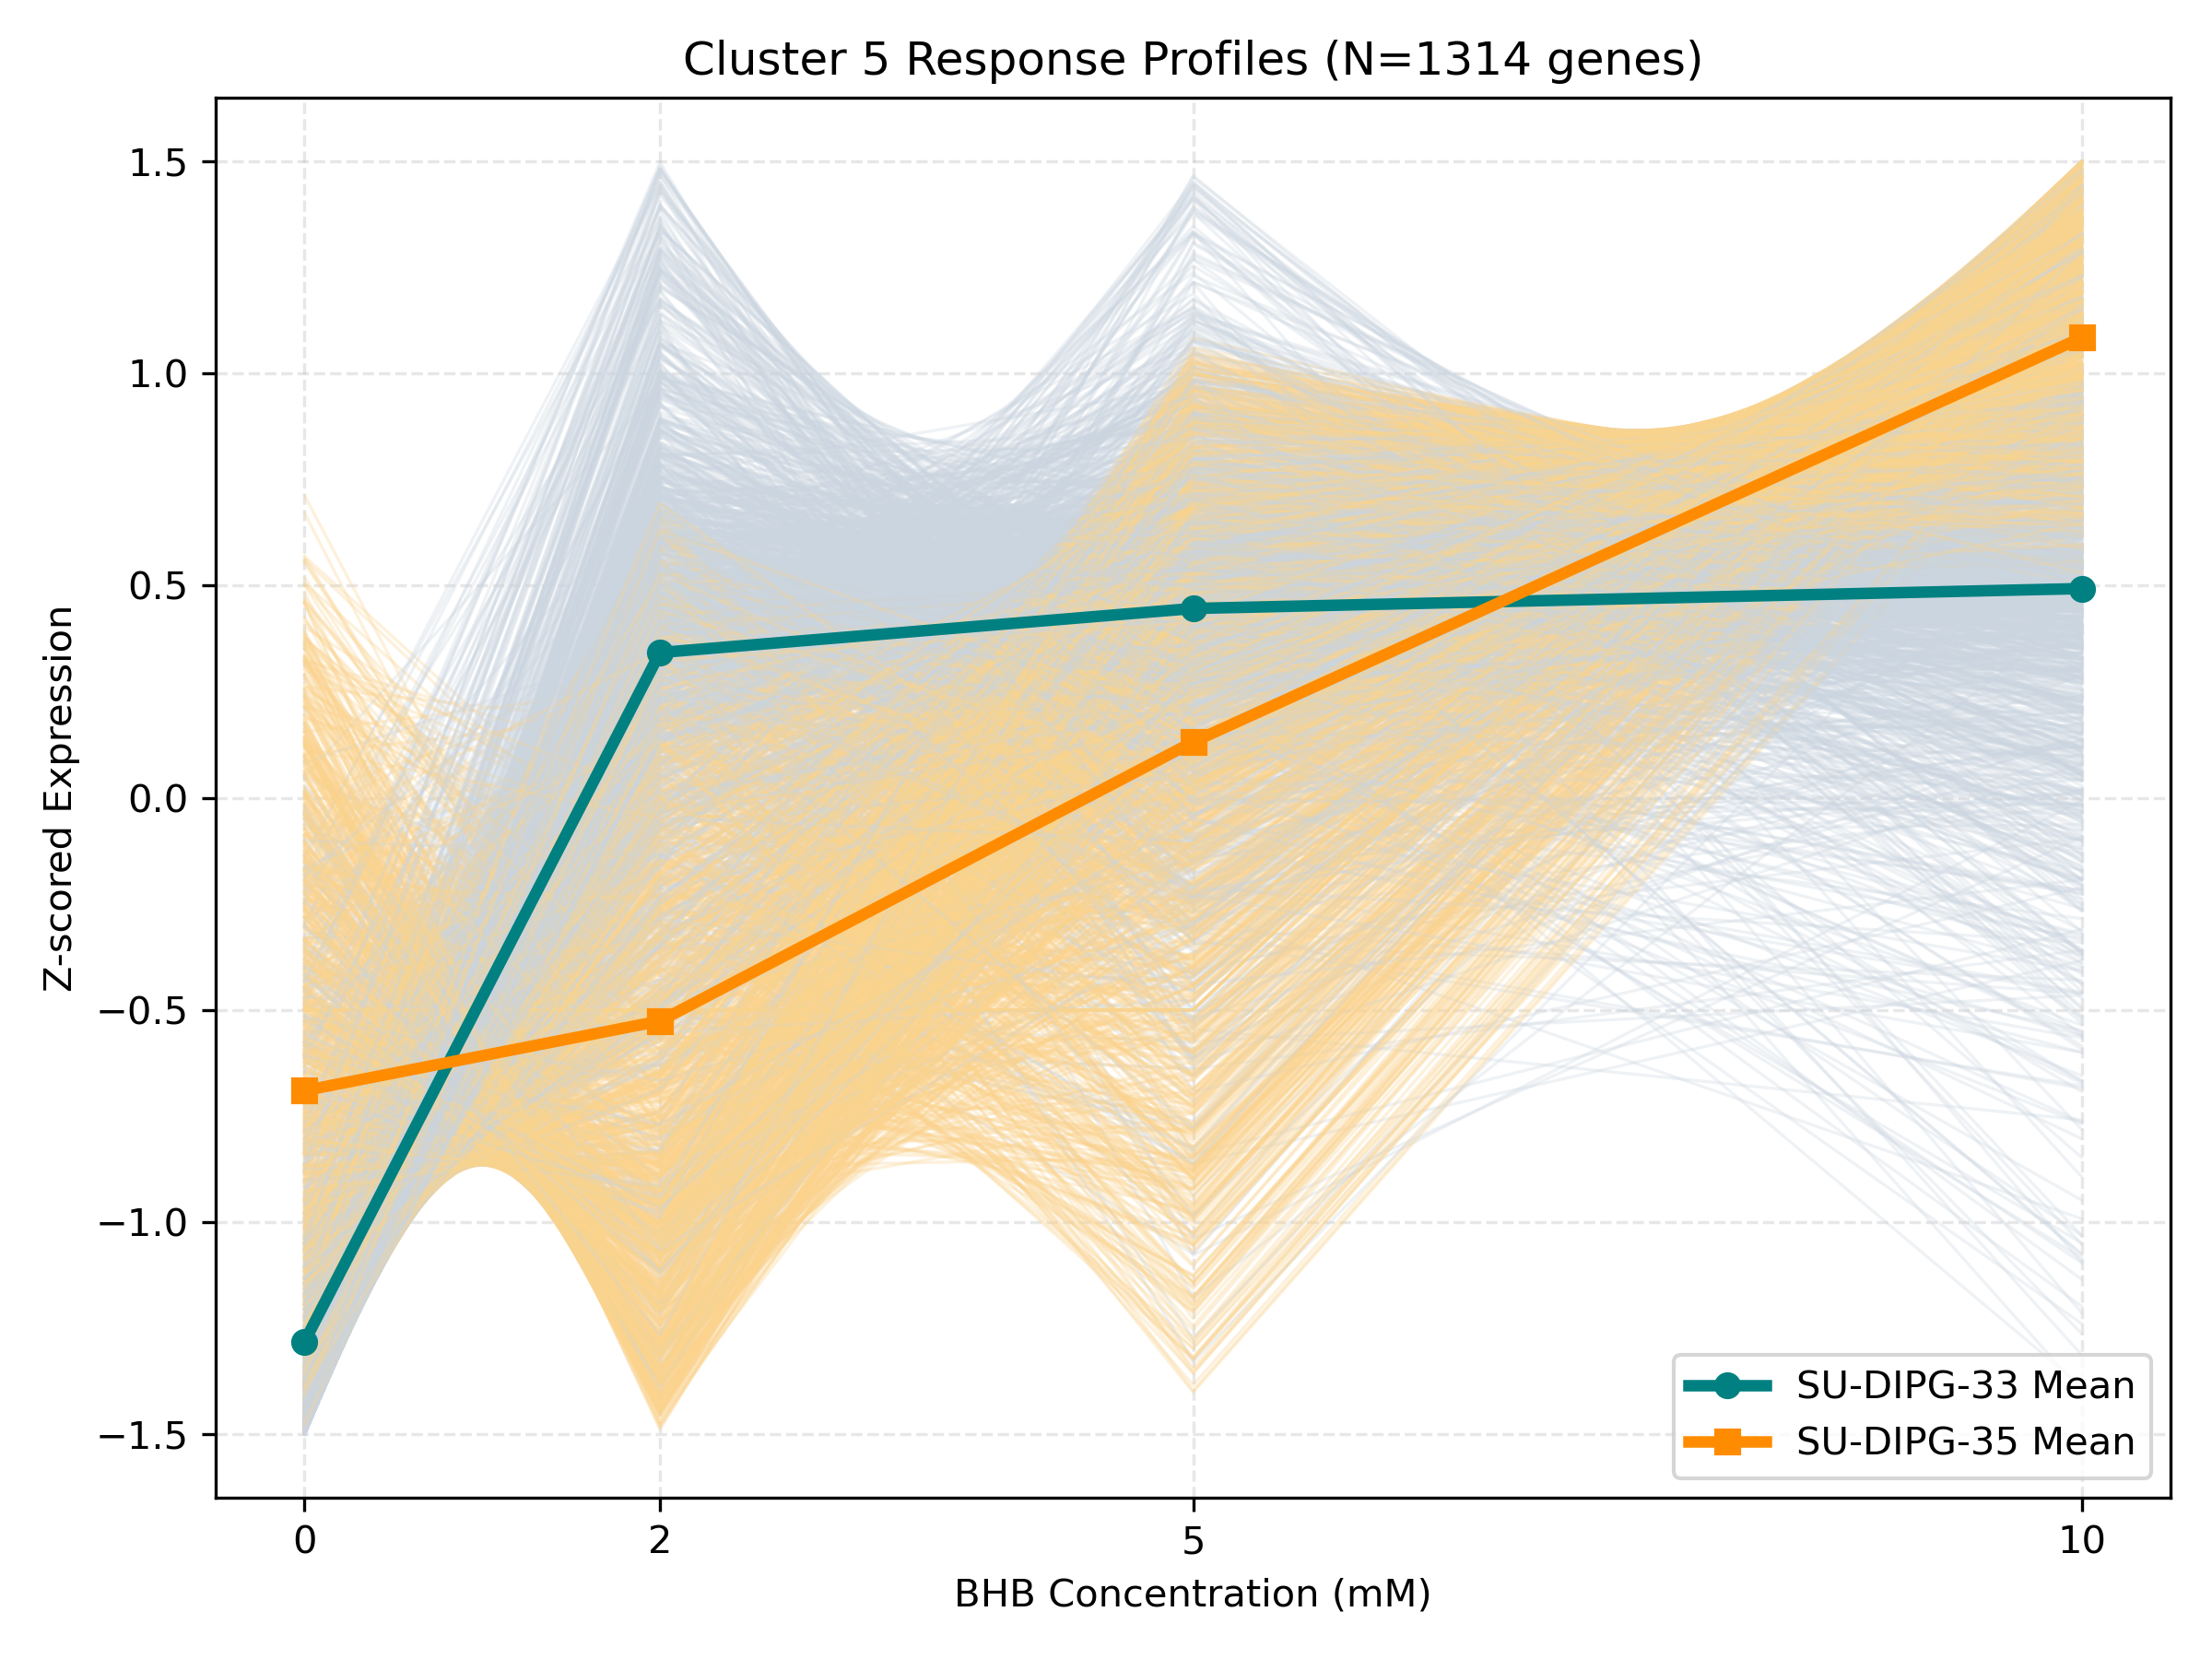
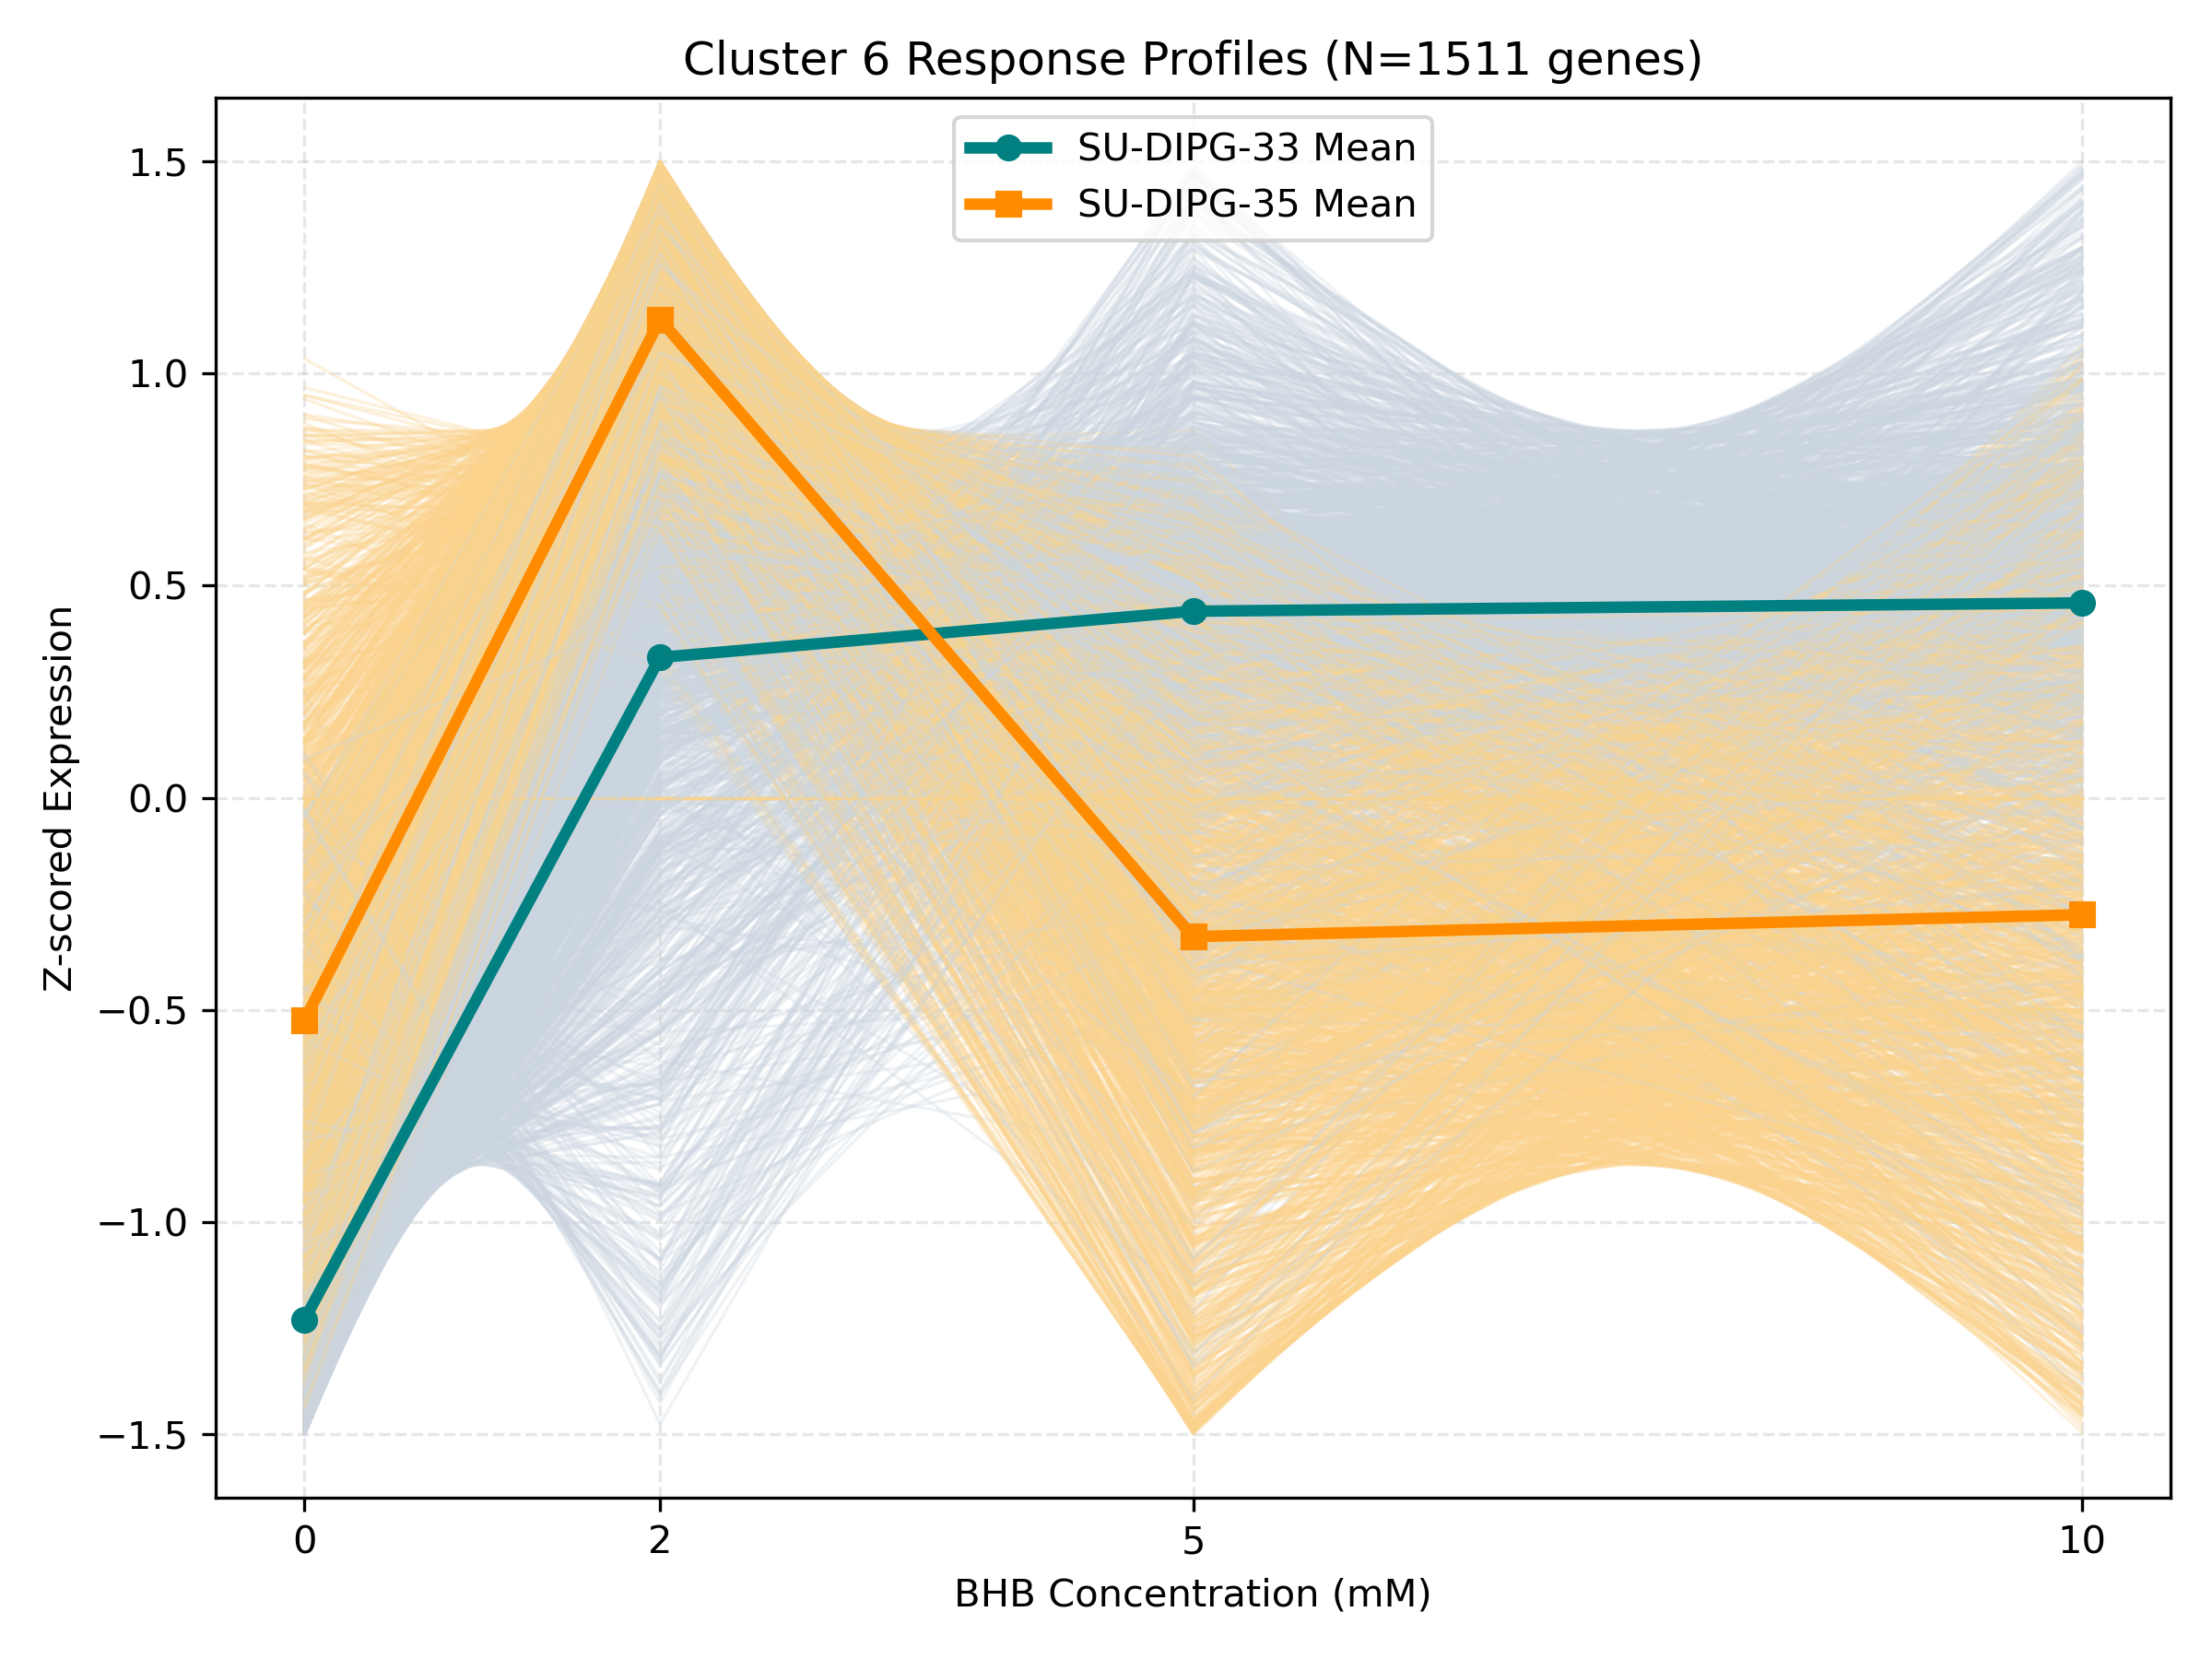
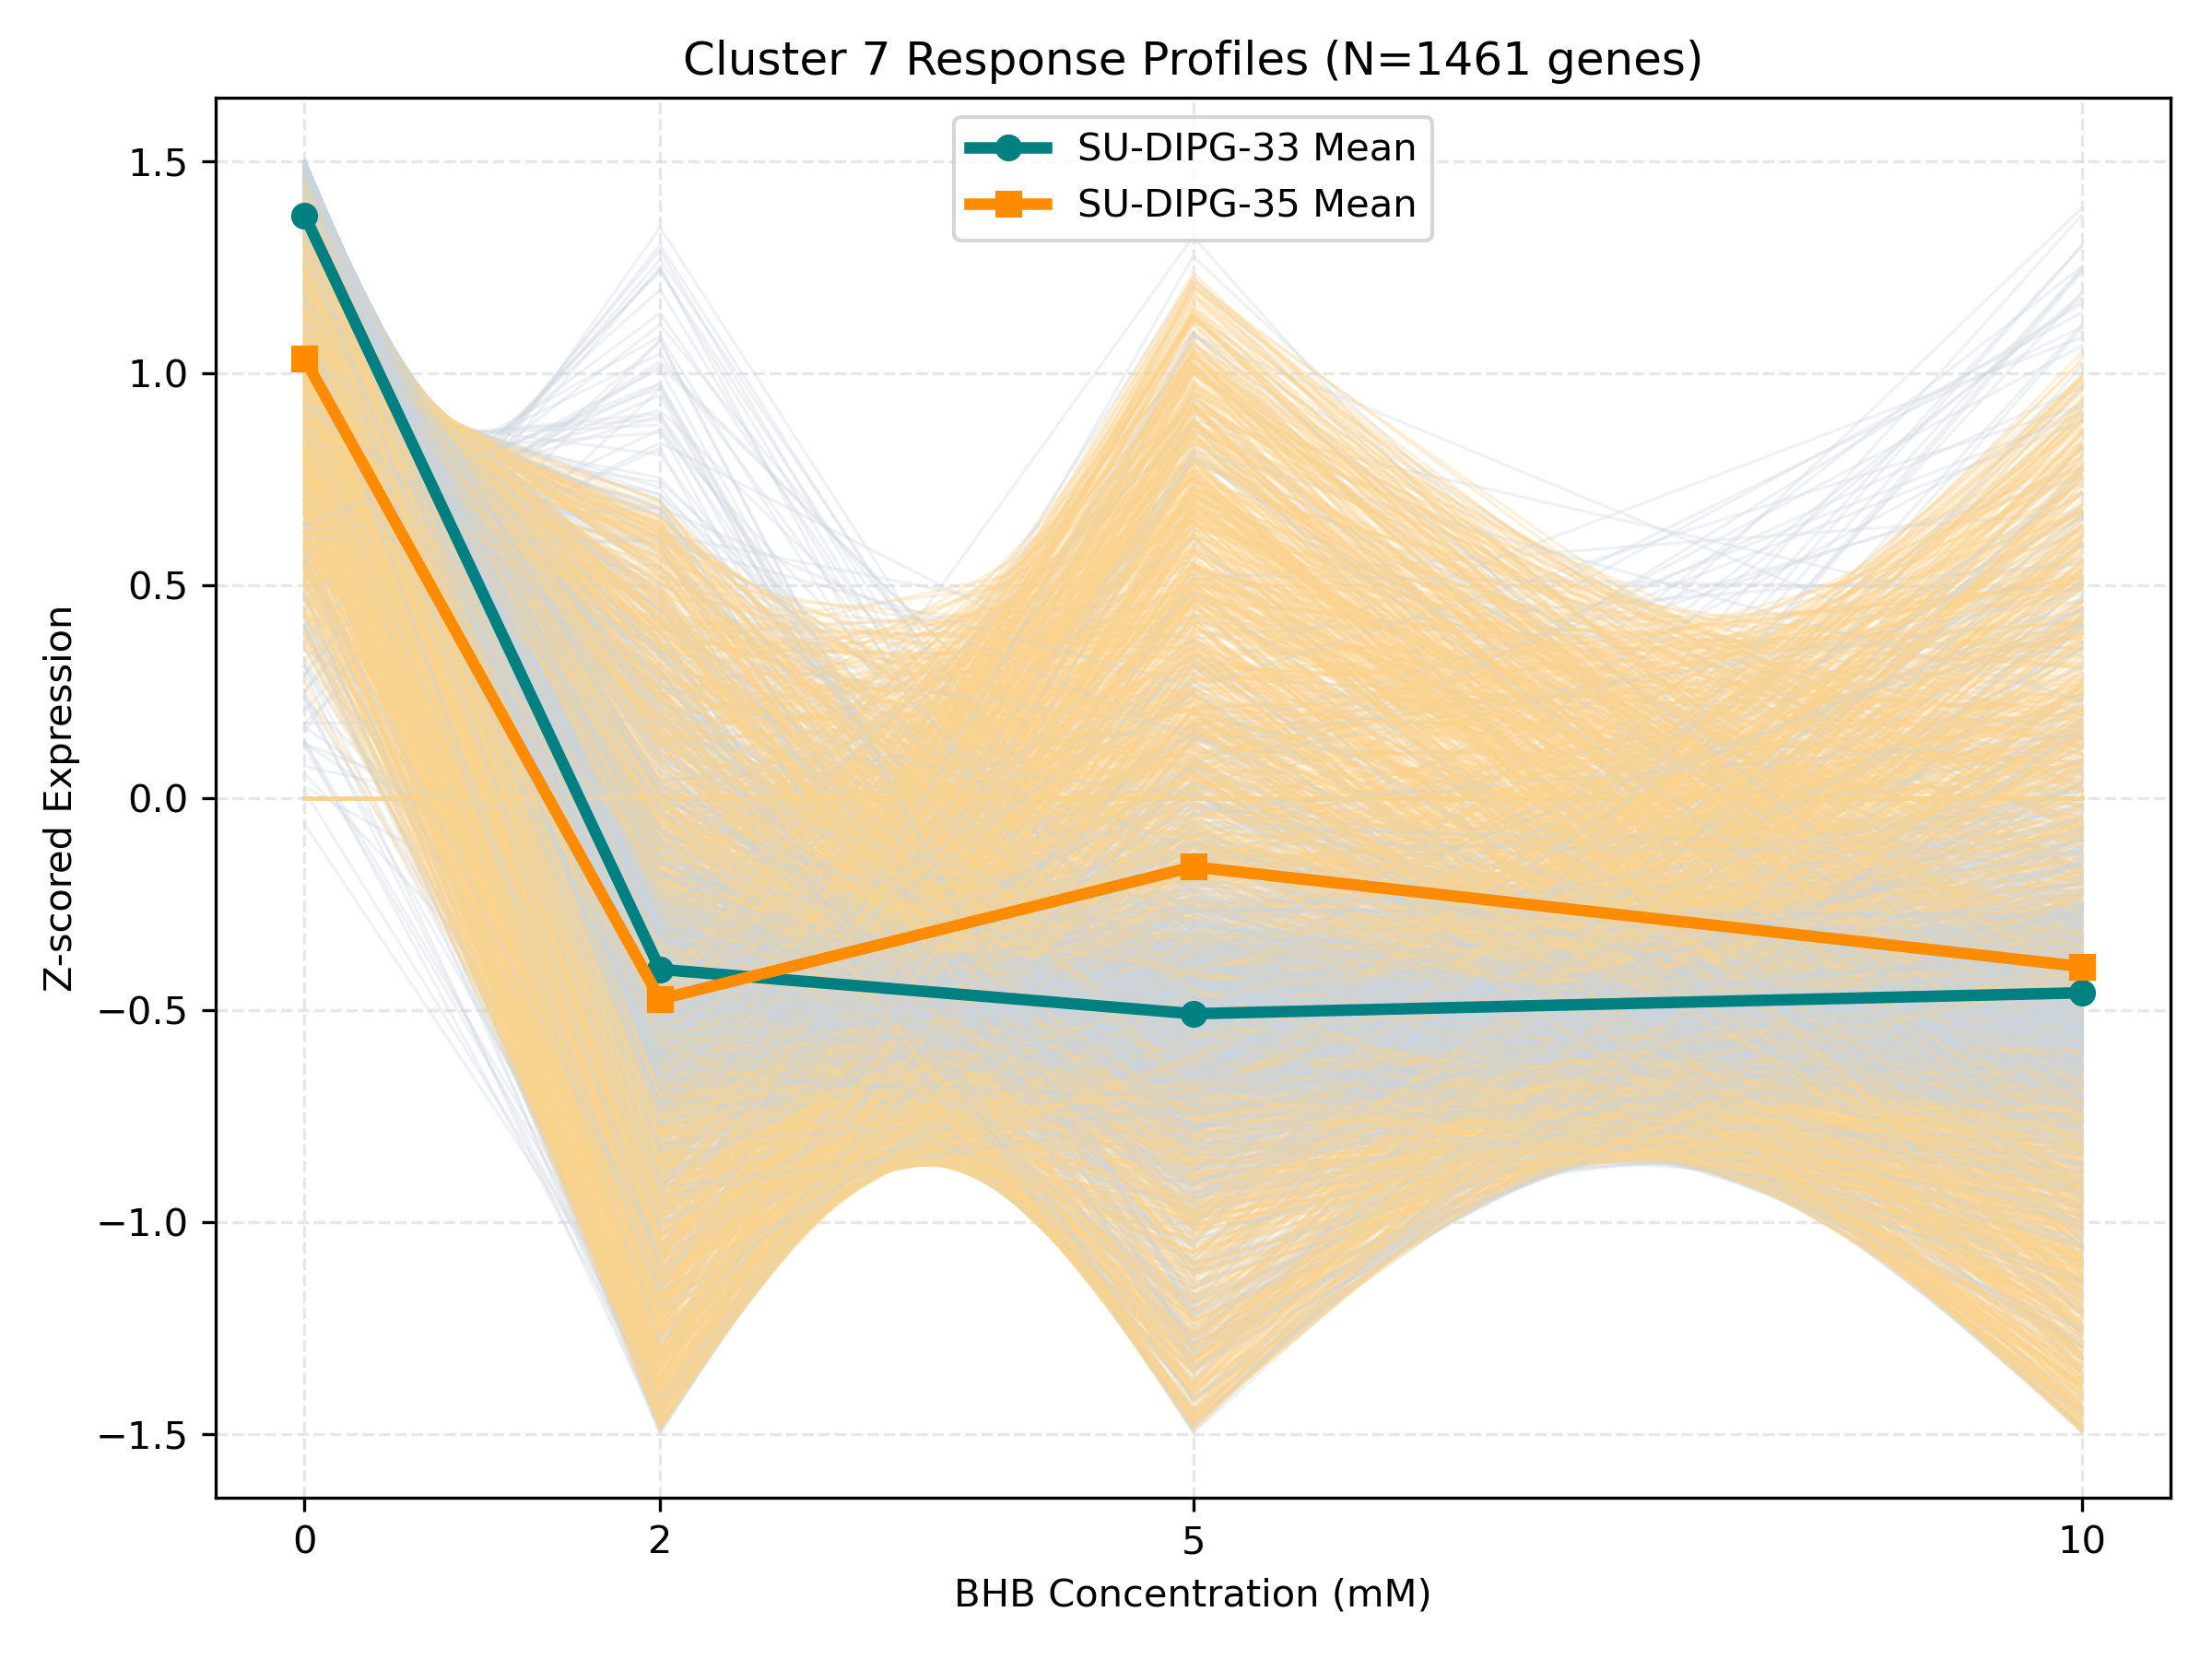
- Profile Plots: Z-scored TPM expression is plotted on the Y-axis. Light gray/orange lines are individual genes; the bold lines are the cluster means for each cell line.
- Linear/Monotonic trends (consistently upward or downward): Indicate progressive cellular adaptations, such as metabolic substrate switching.
- Threshold trends (flat at 0-5mM, sharp change at 10mM): Suggest signaling thresholds, cellular toxicity, or chromatin remodeling triggers.
- Biphasic trends (peaking/dipping at 2mM or 5mM, returning to baseline at 10mM): Represent homeostatic compensation mechanisms.
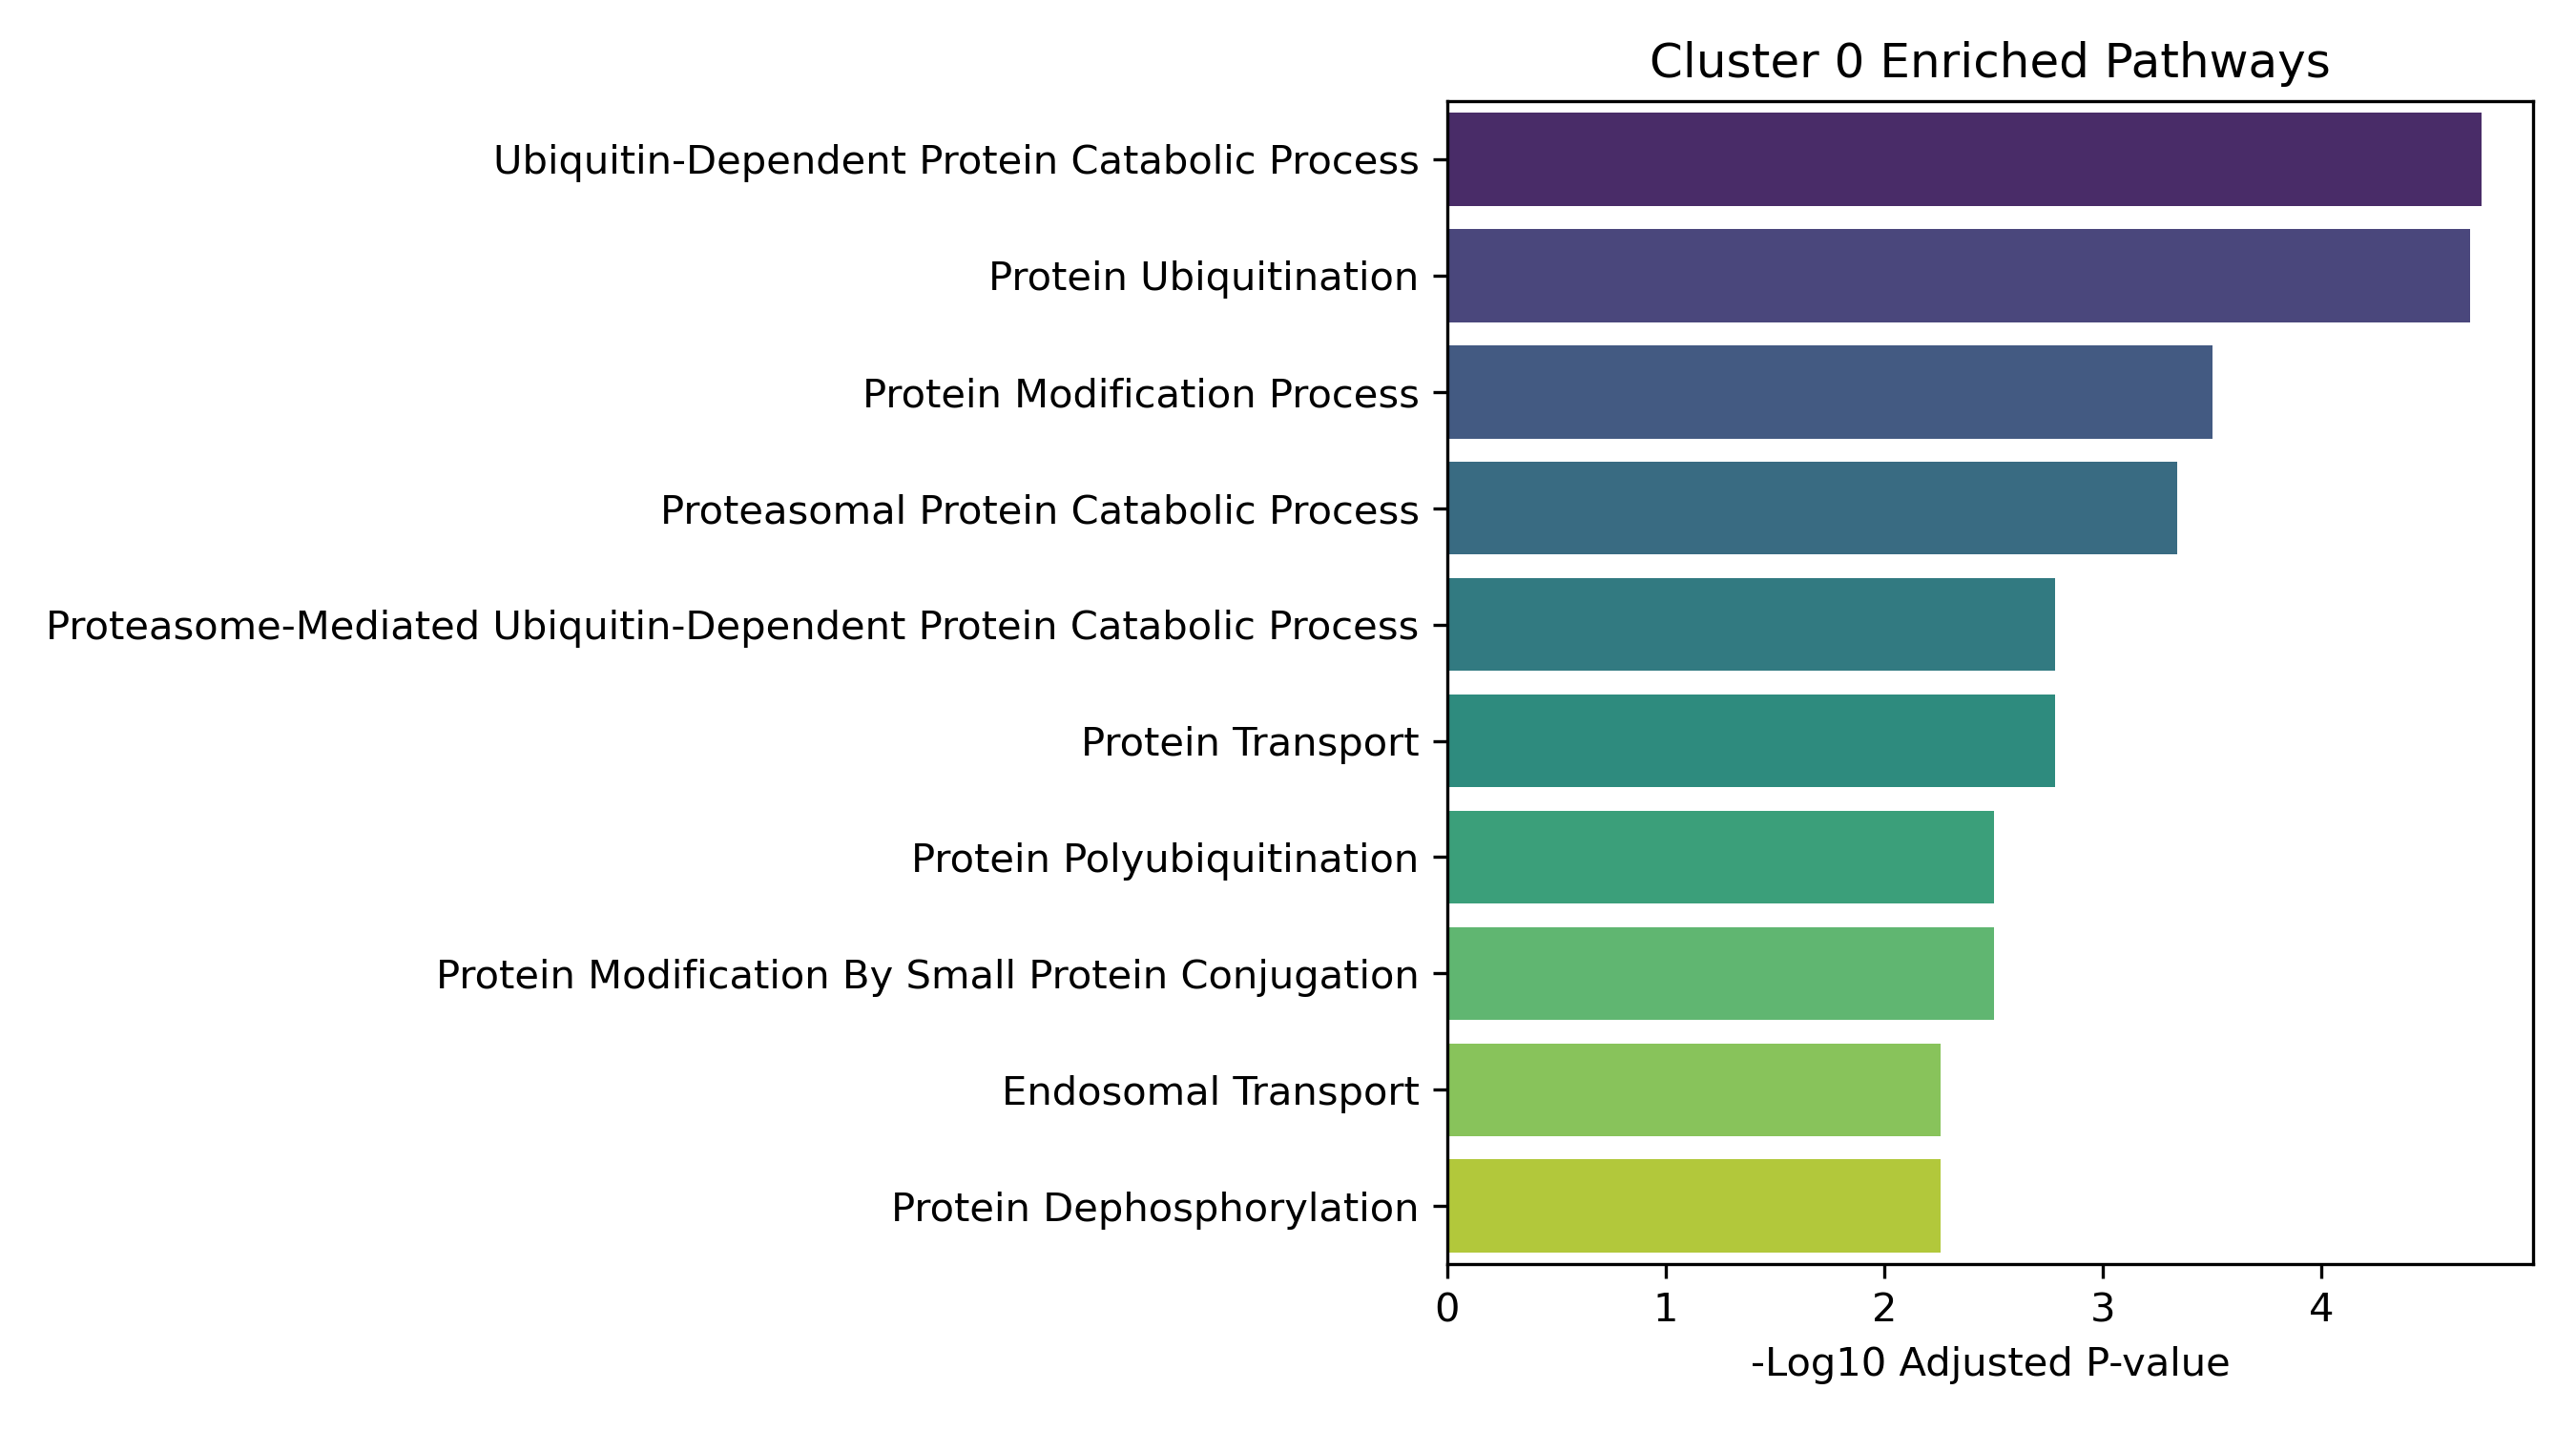
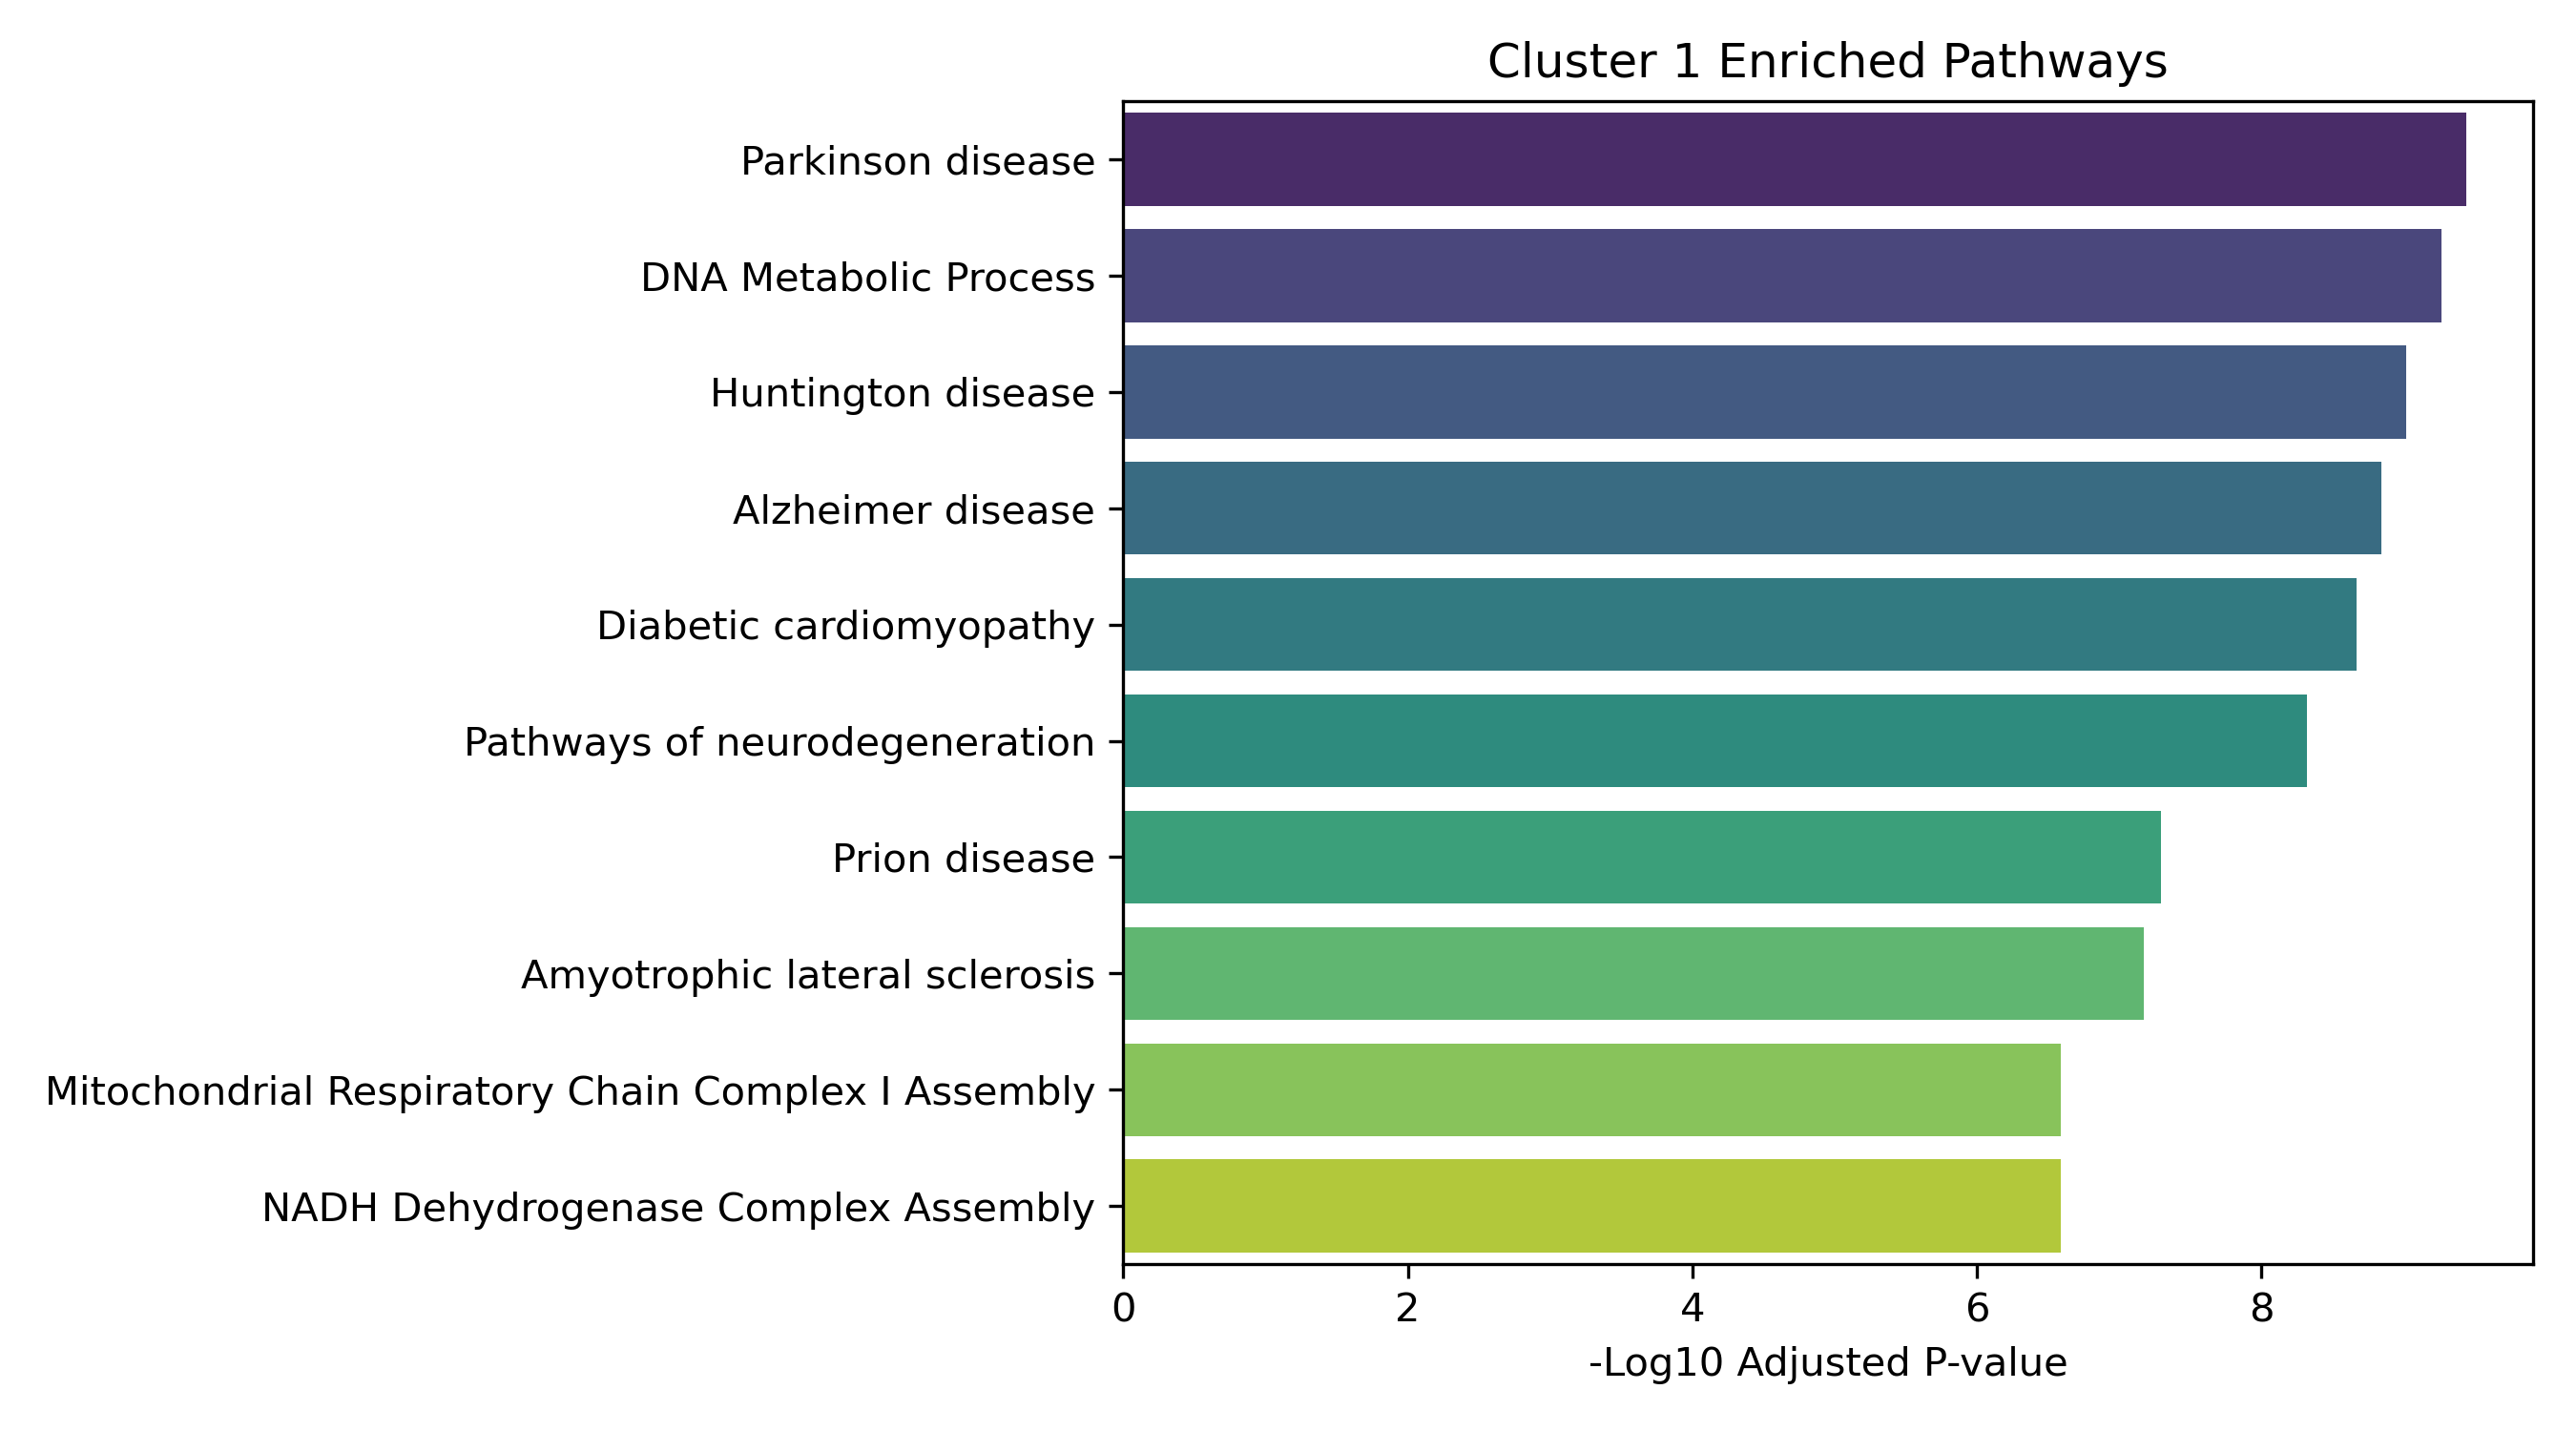
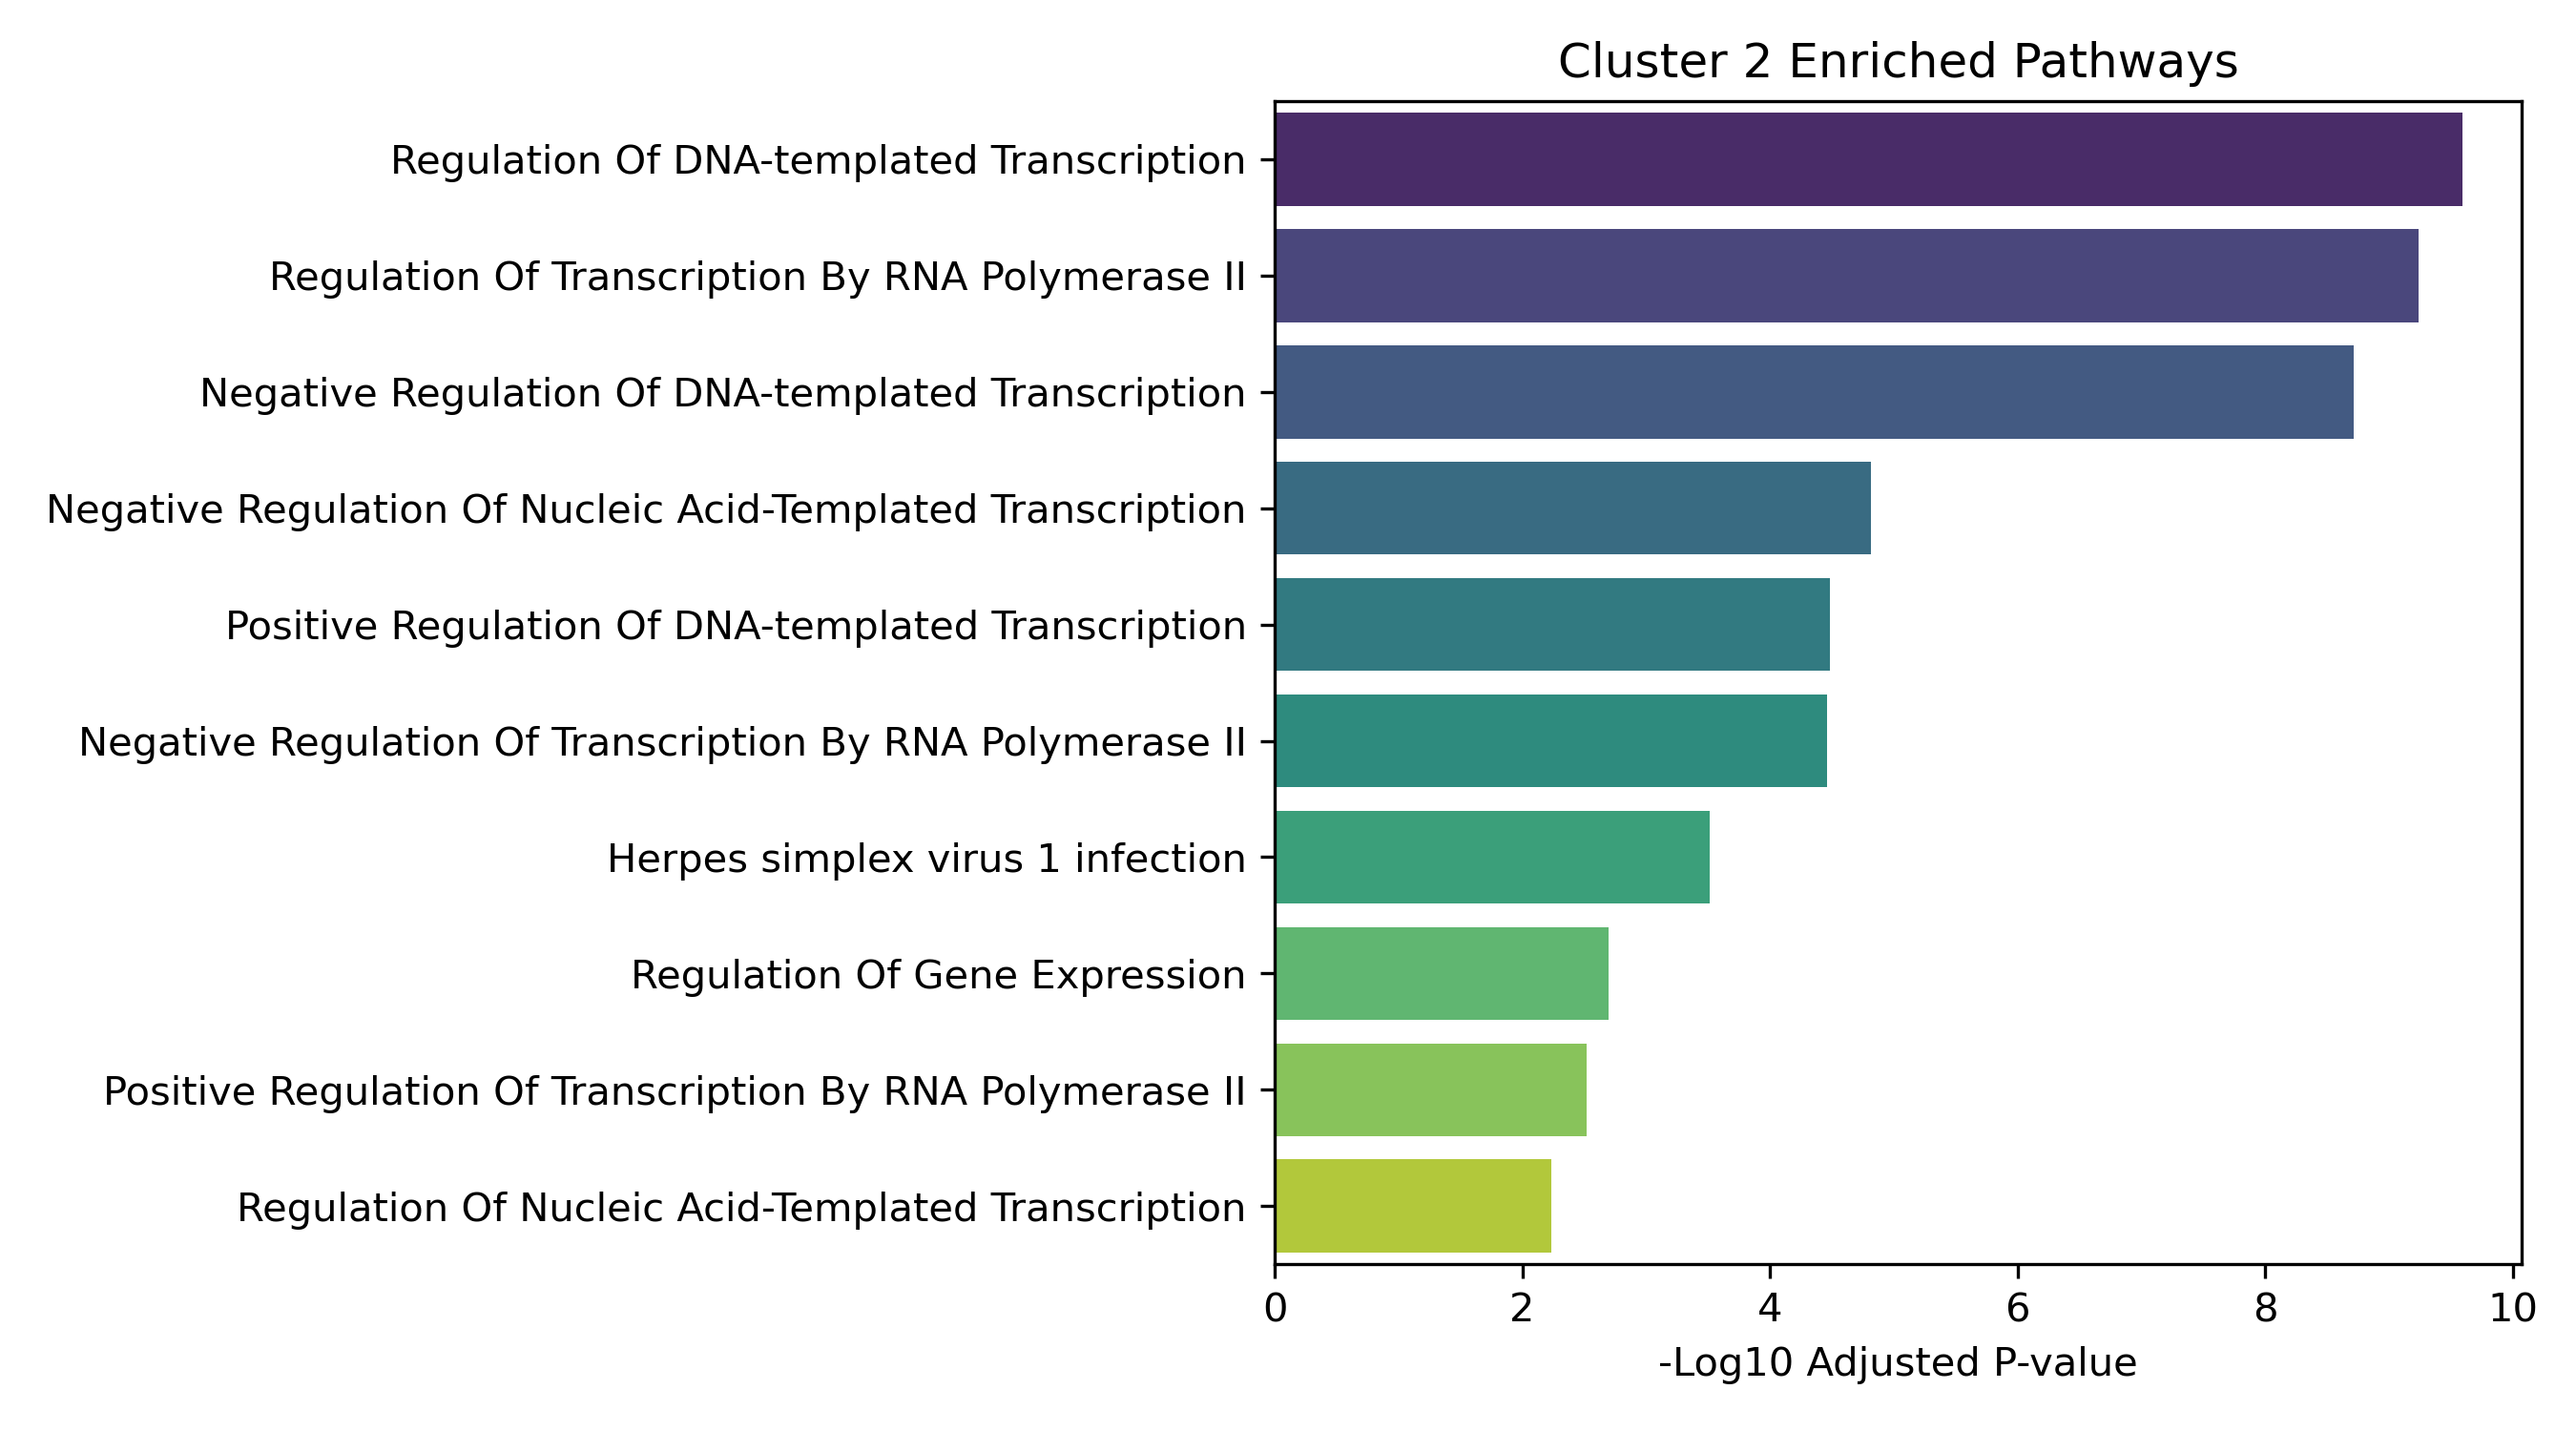
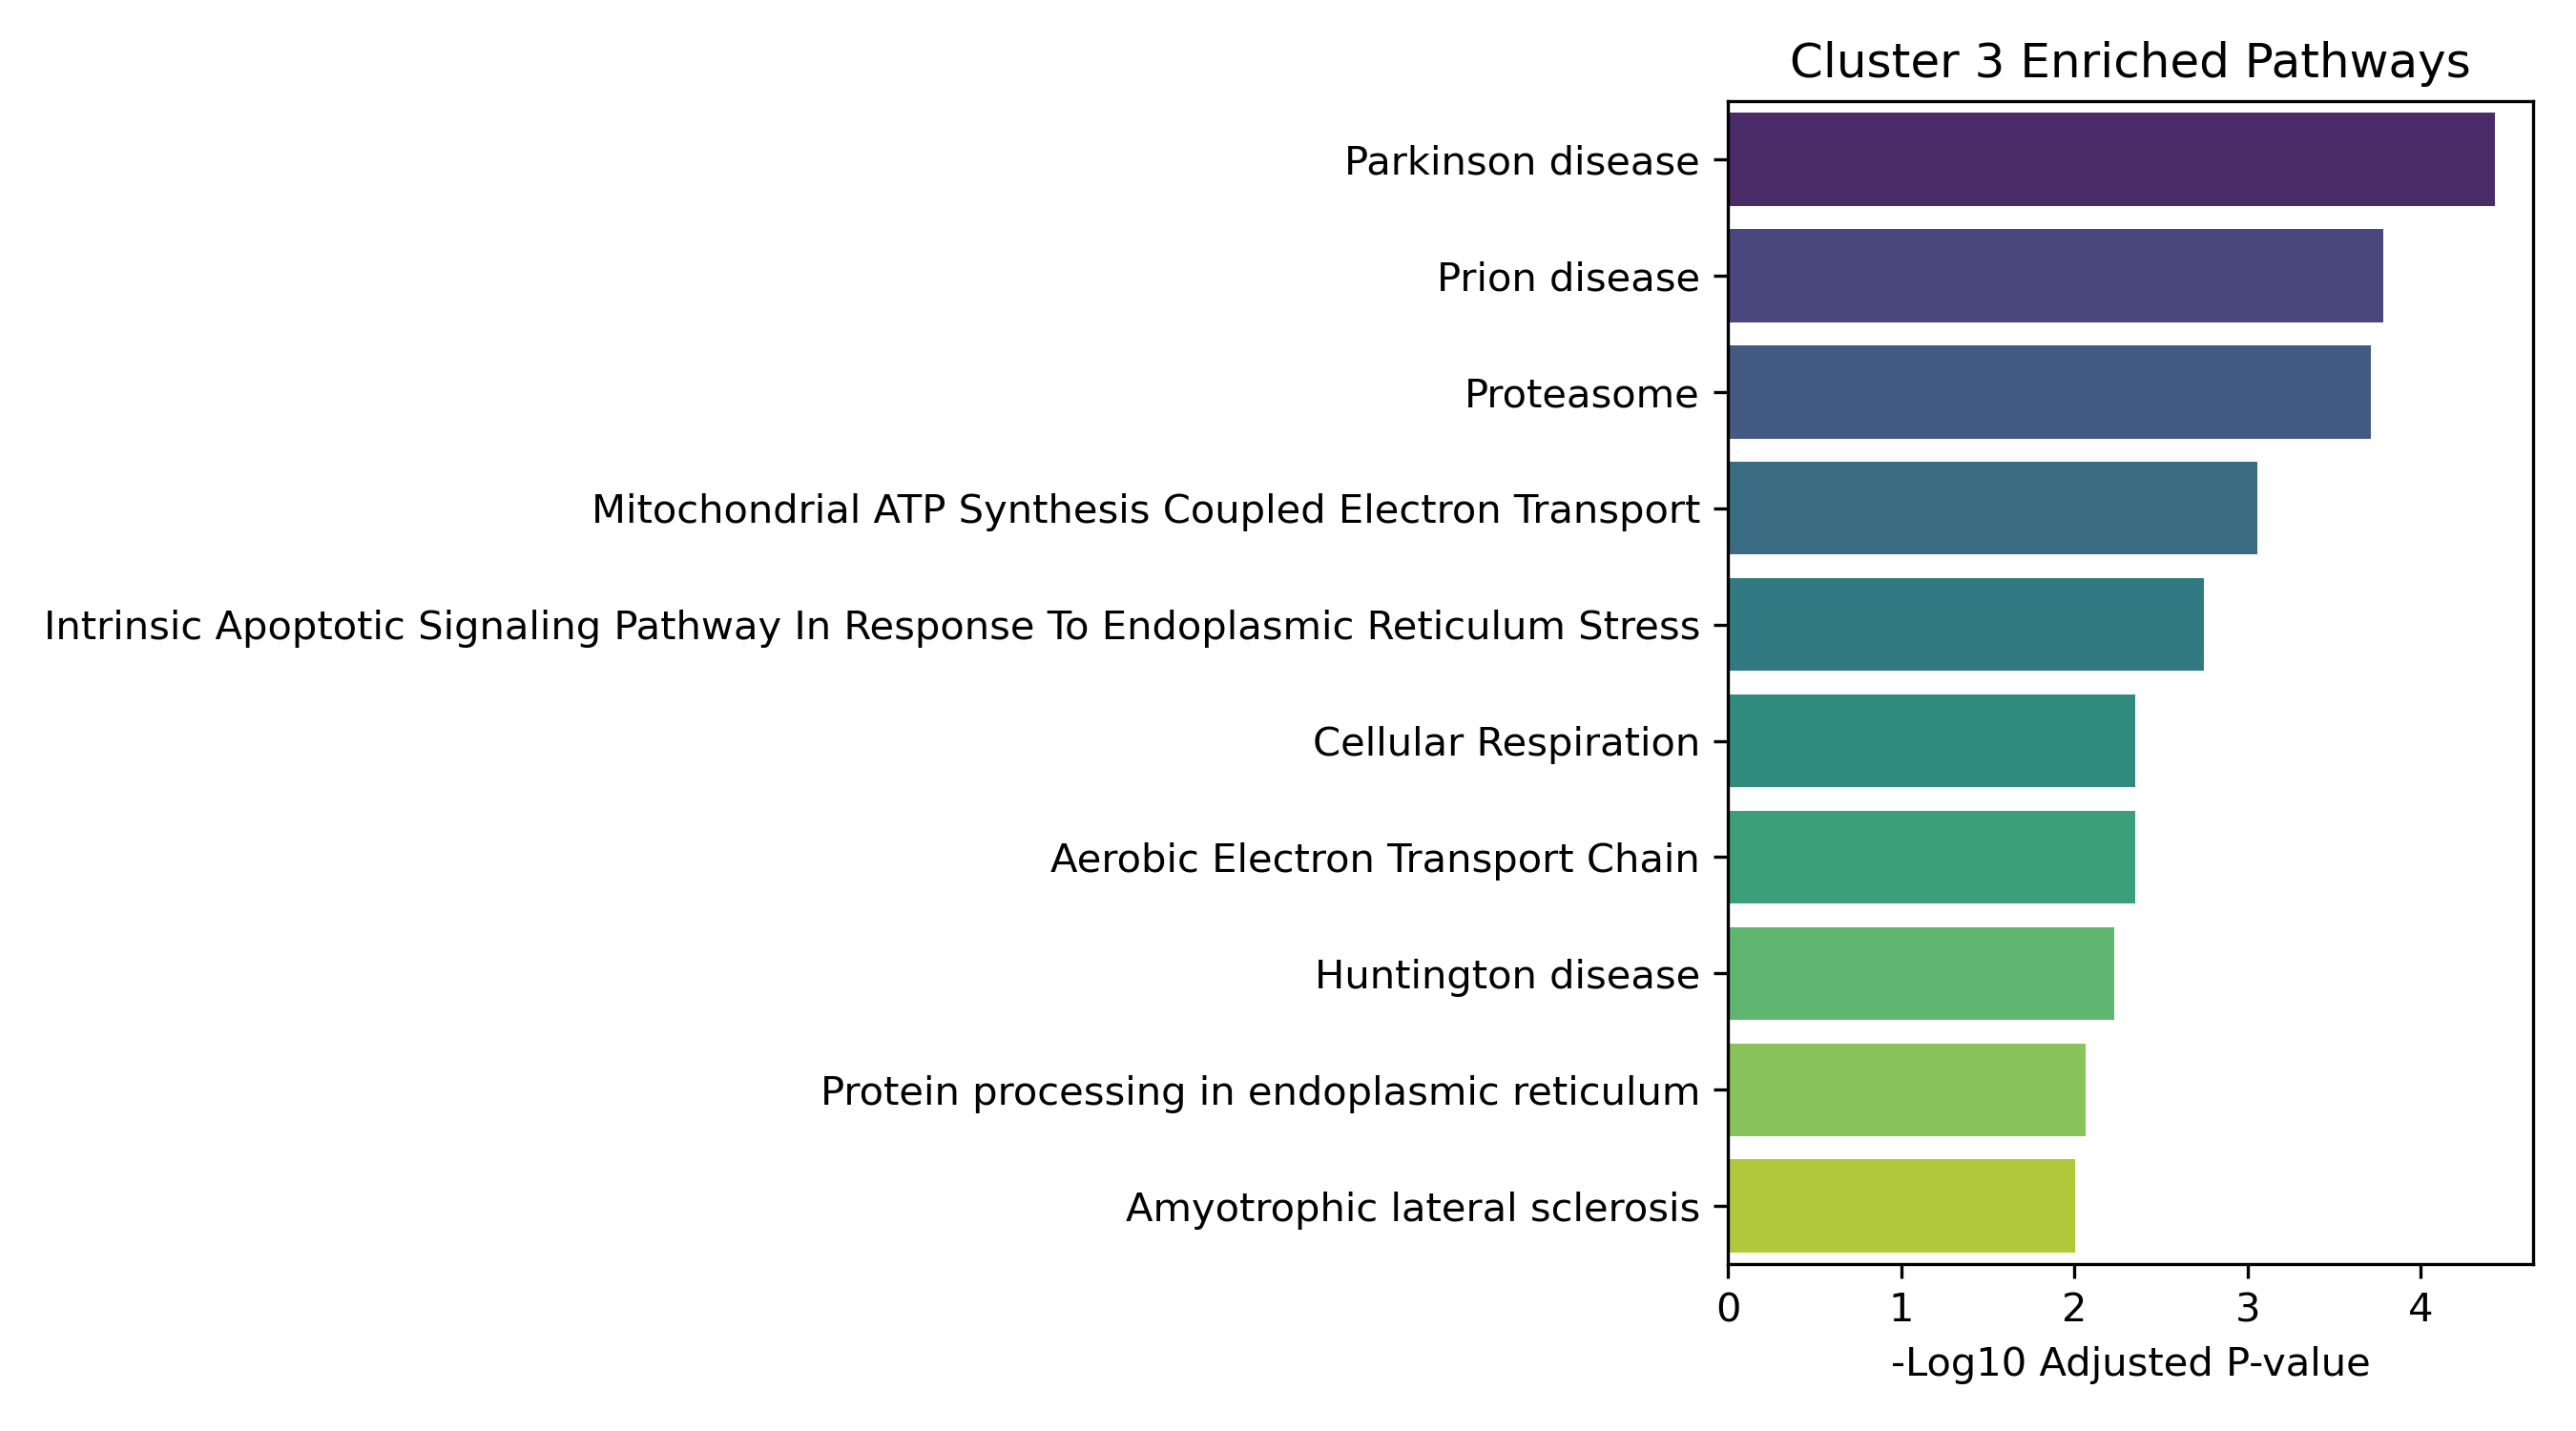
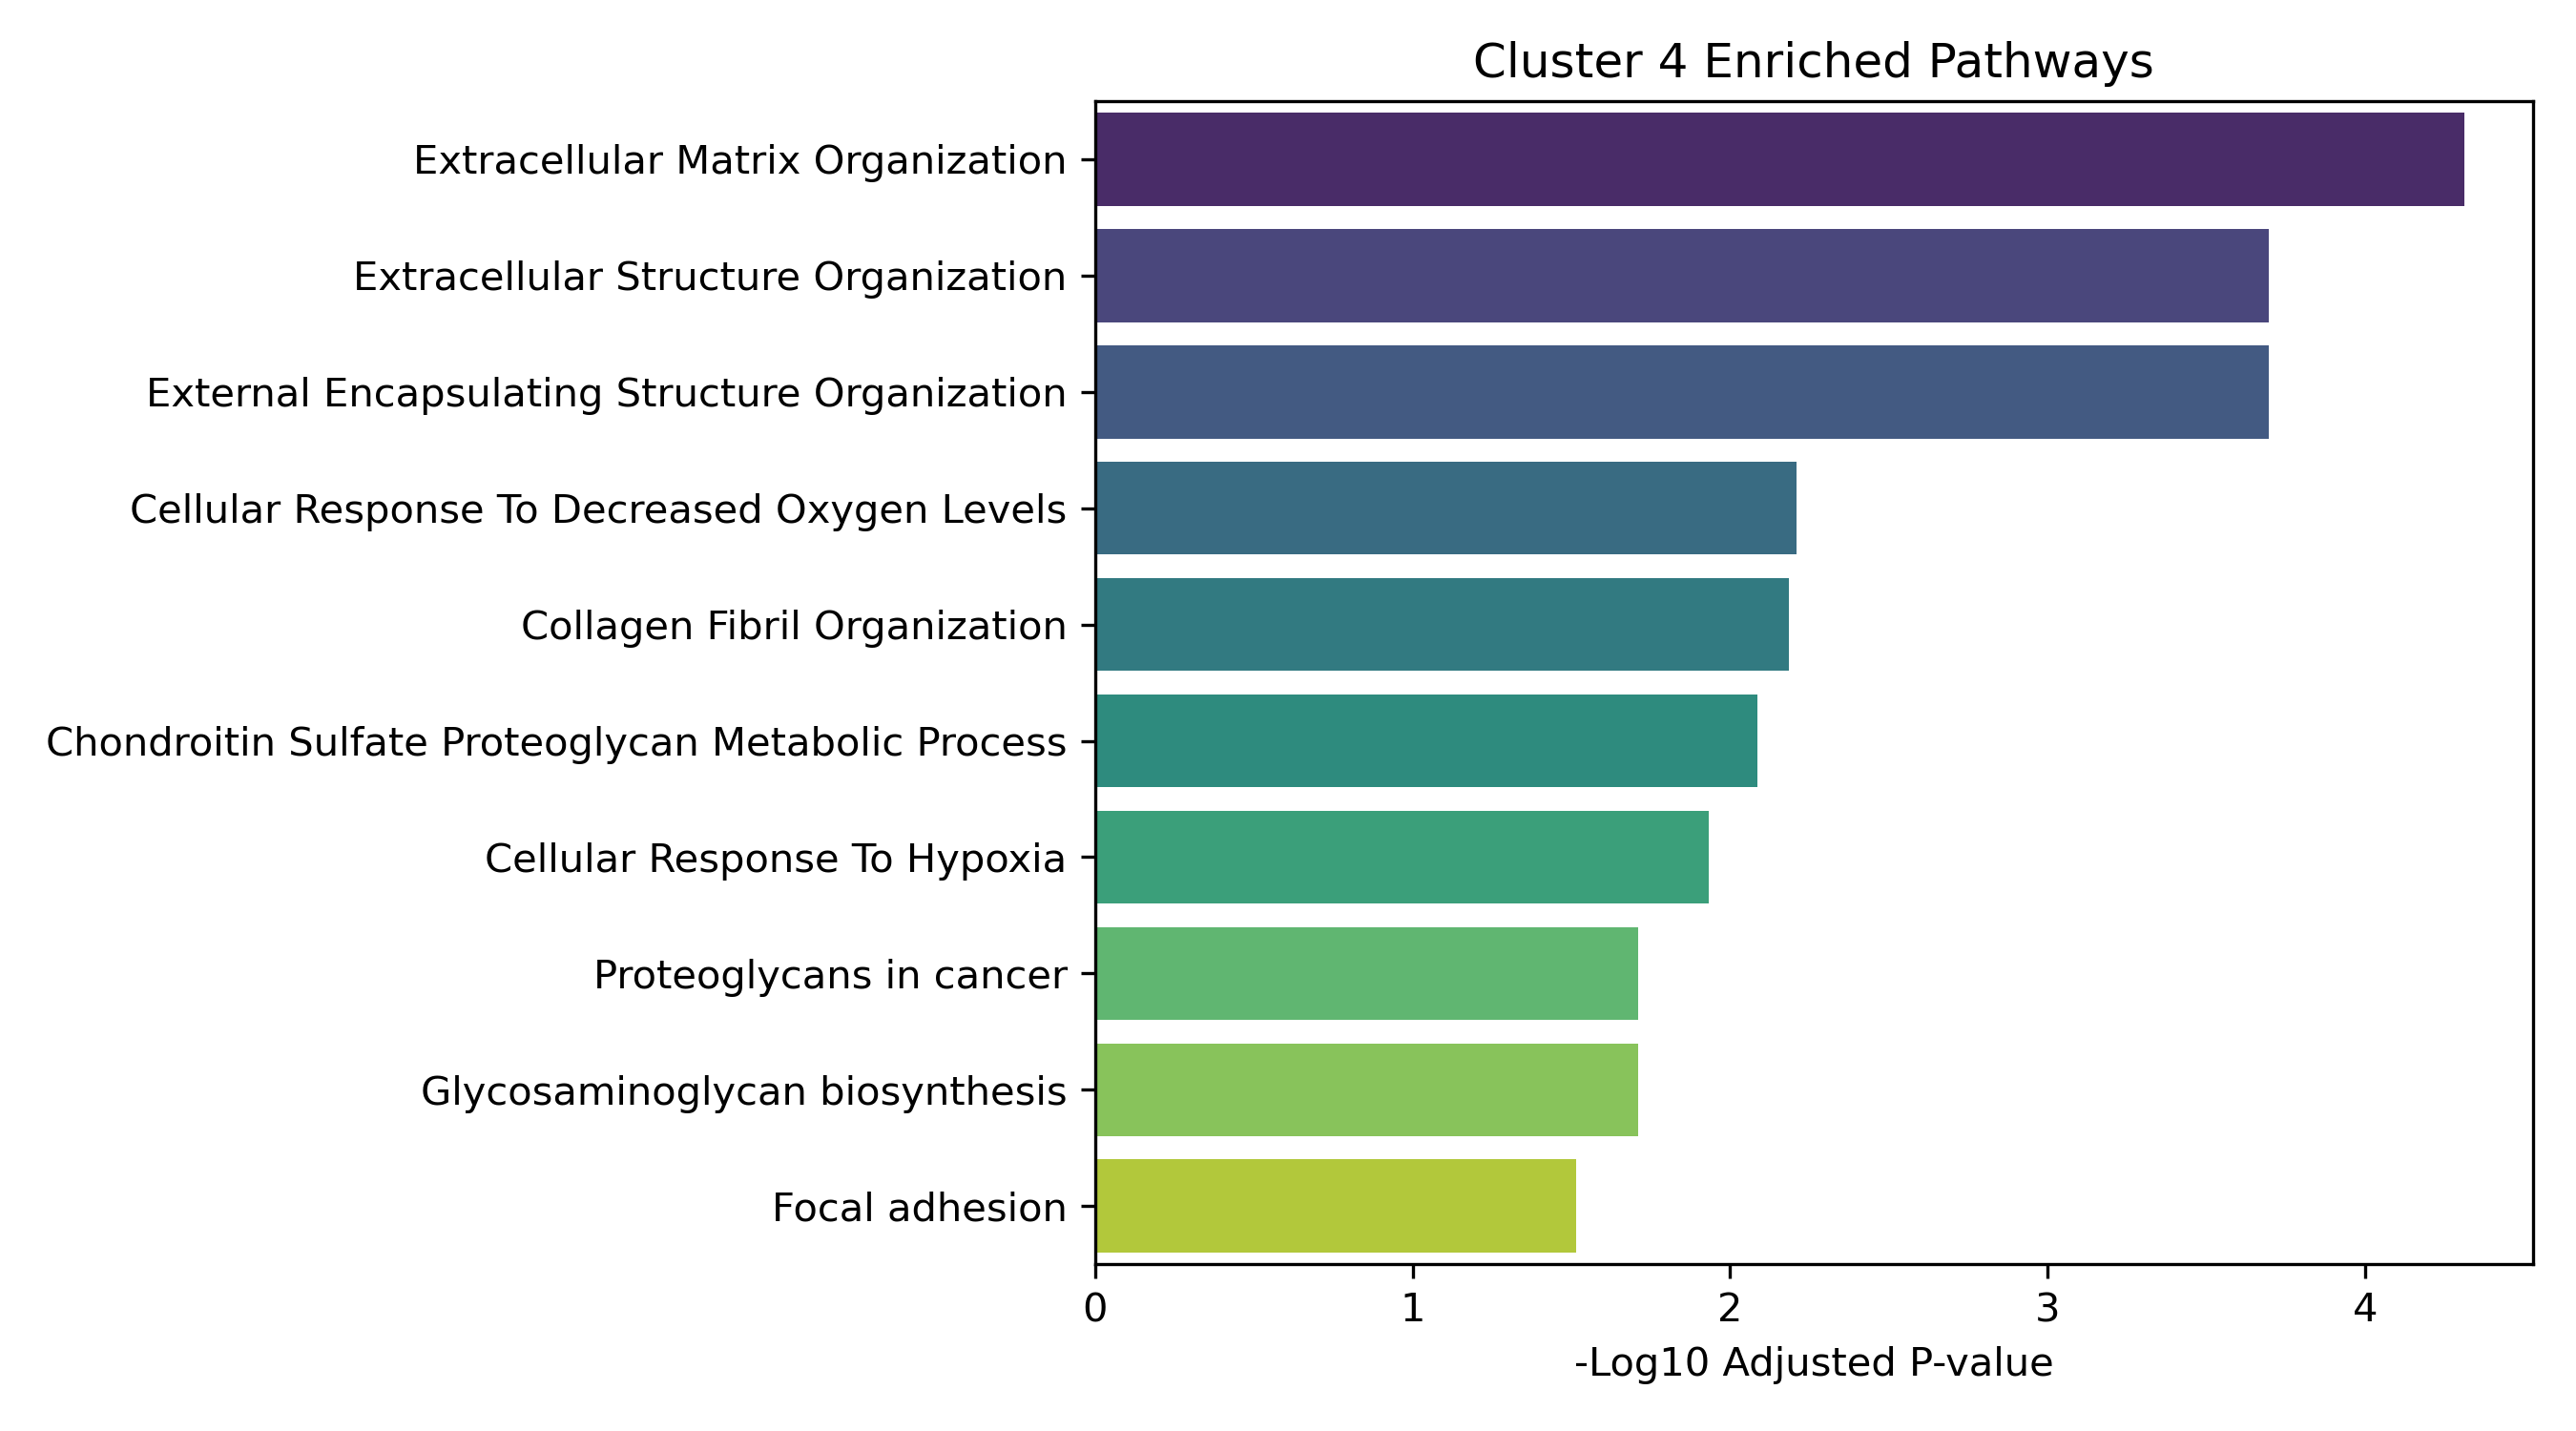
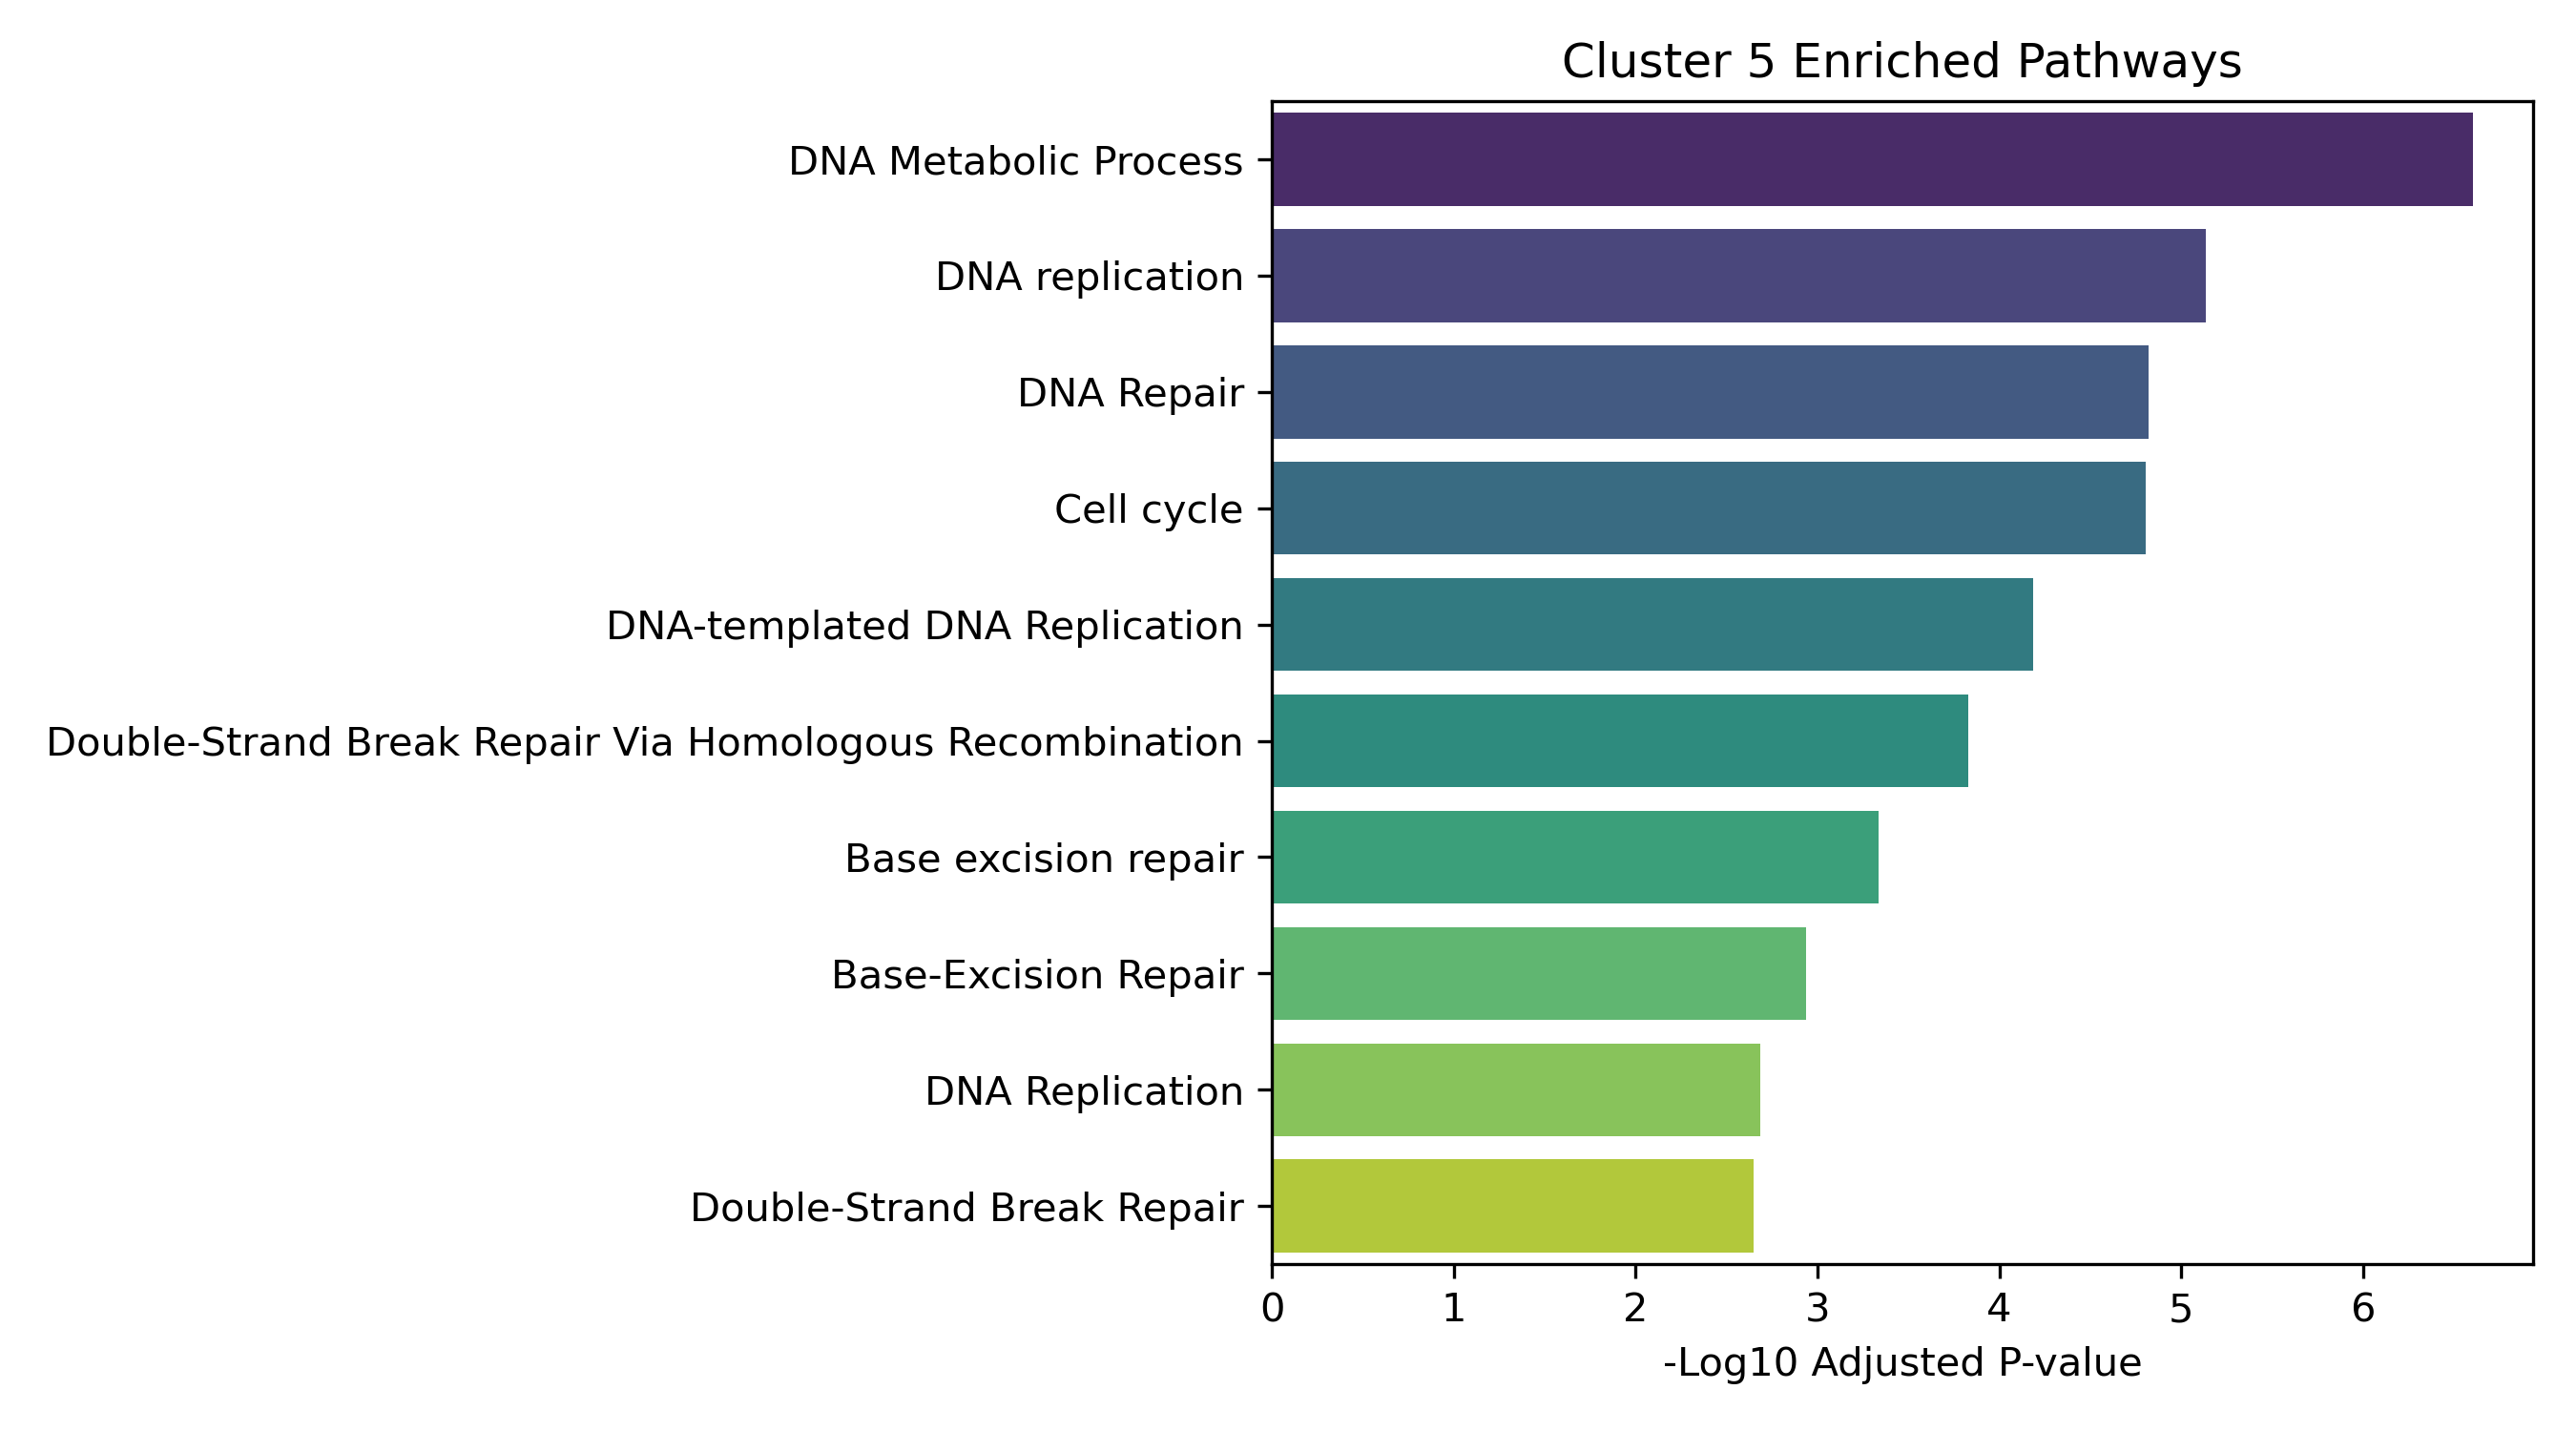
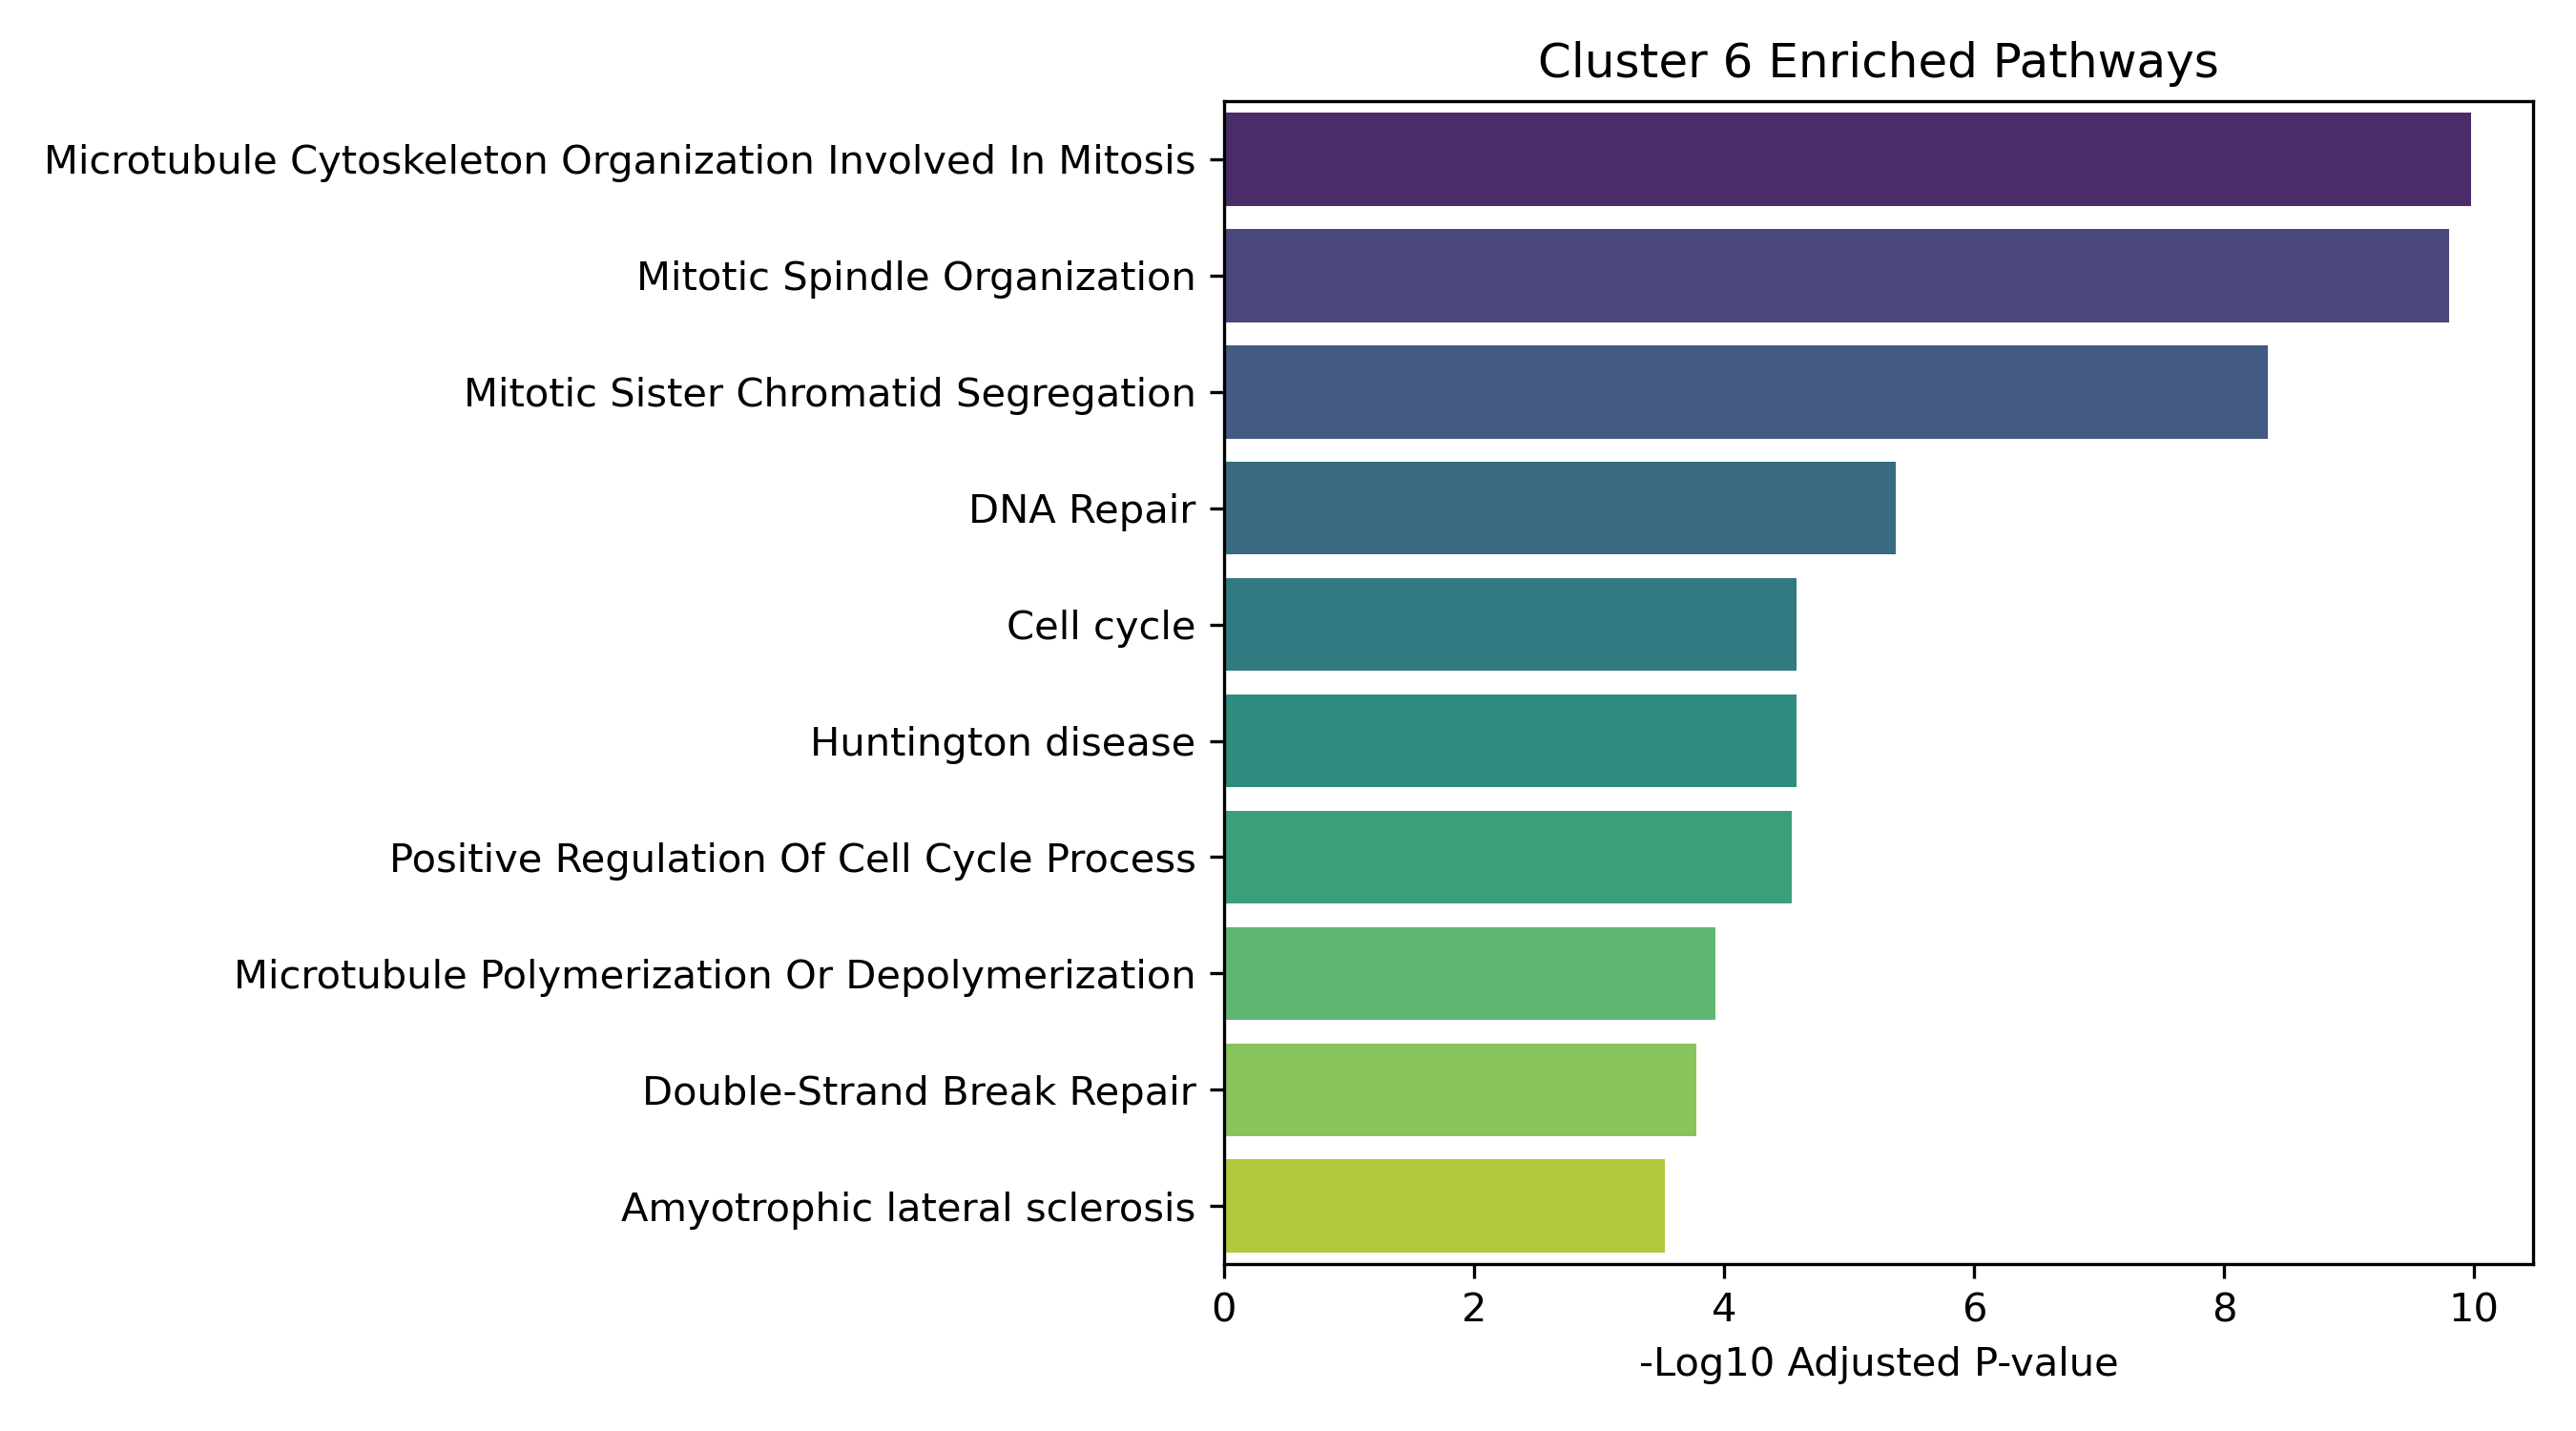
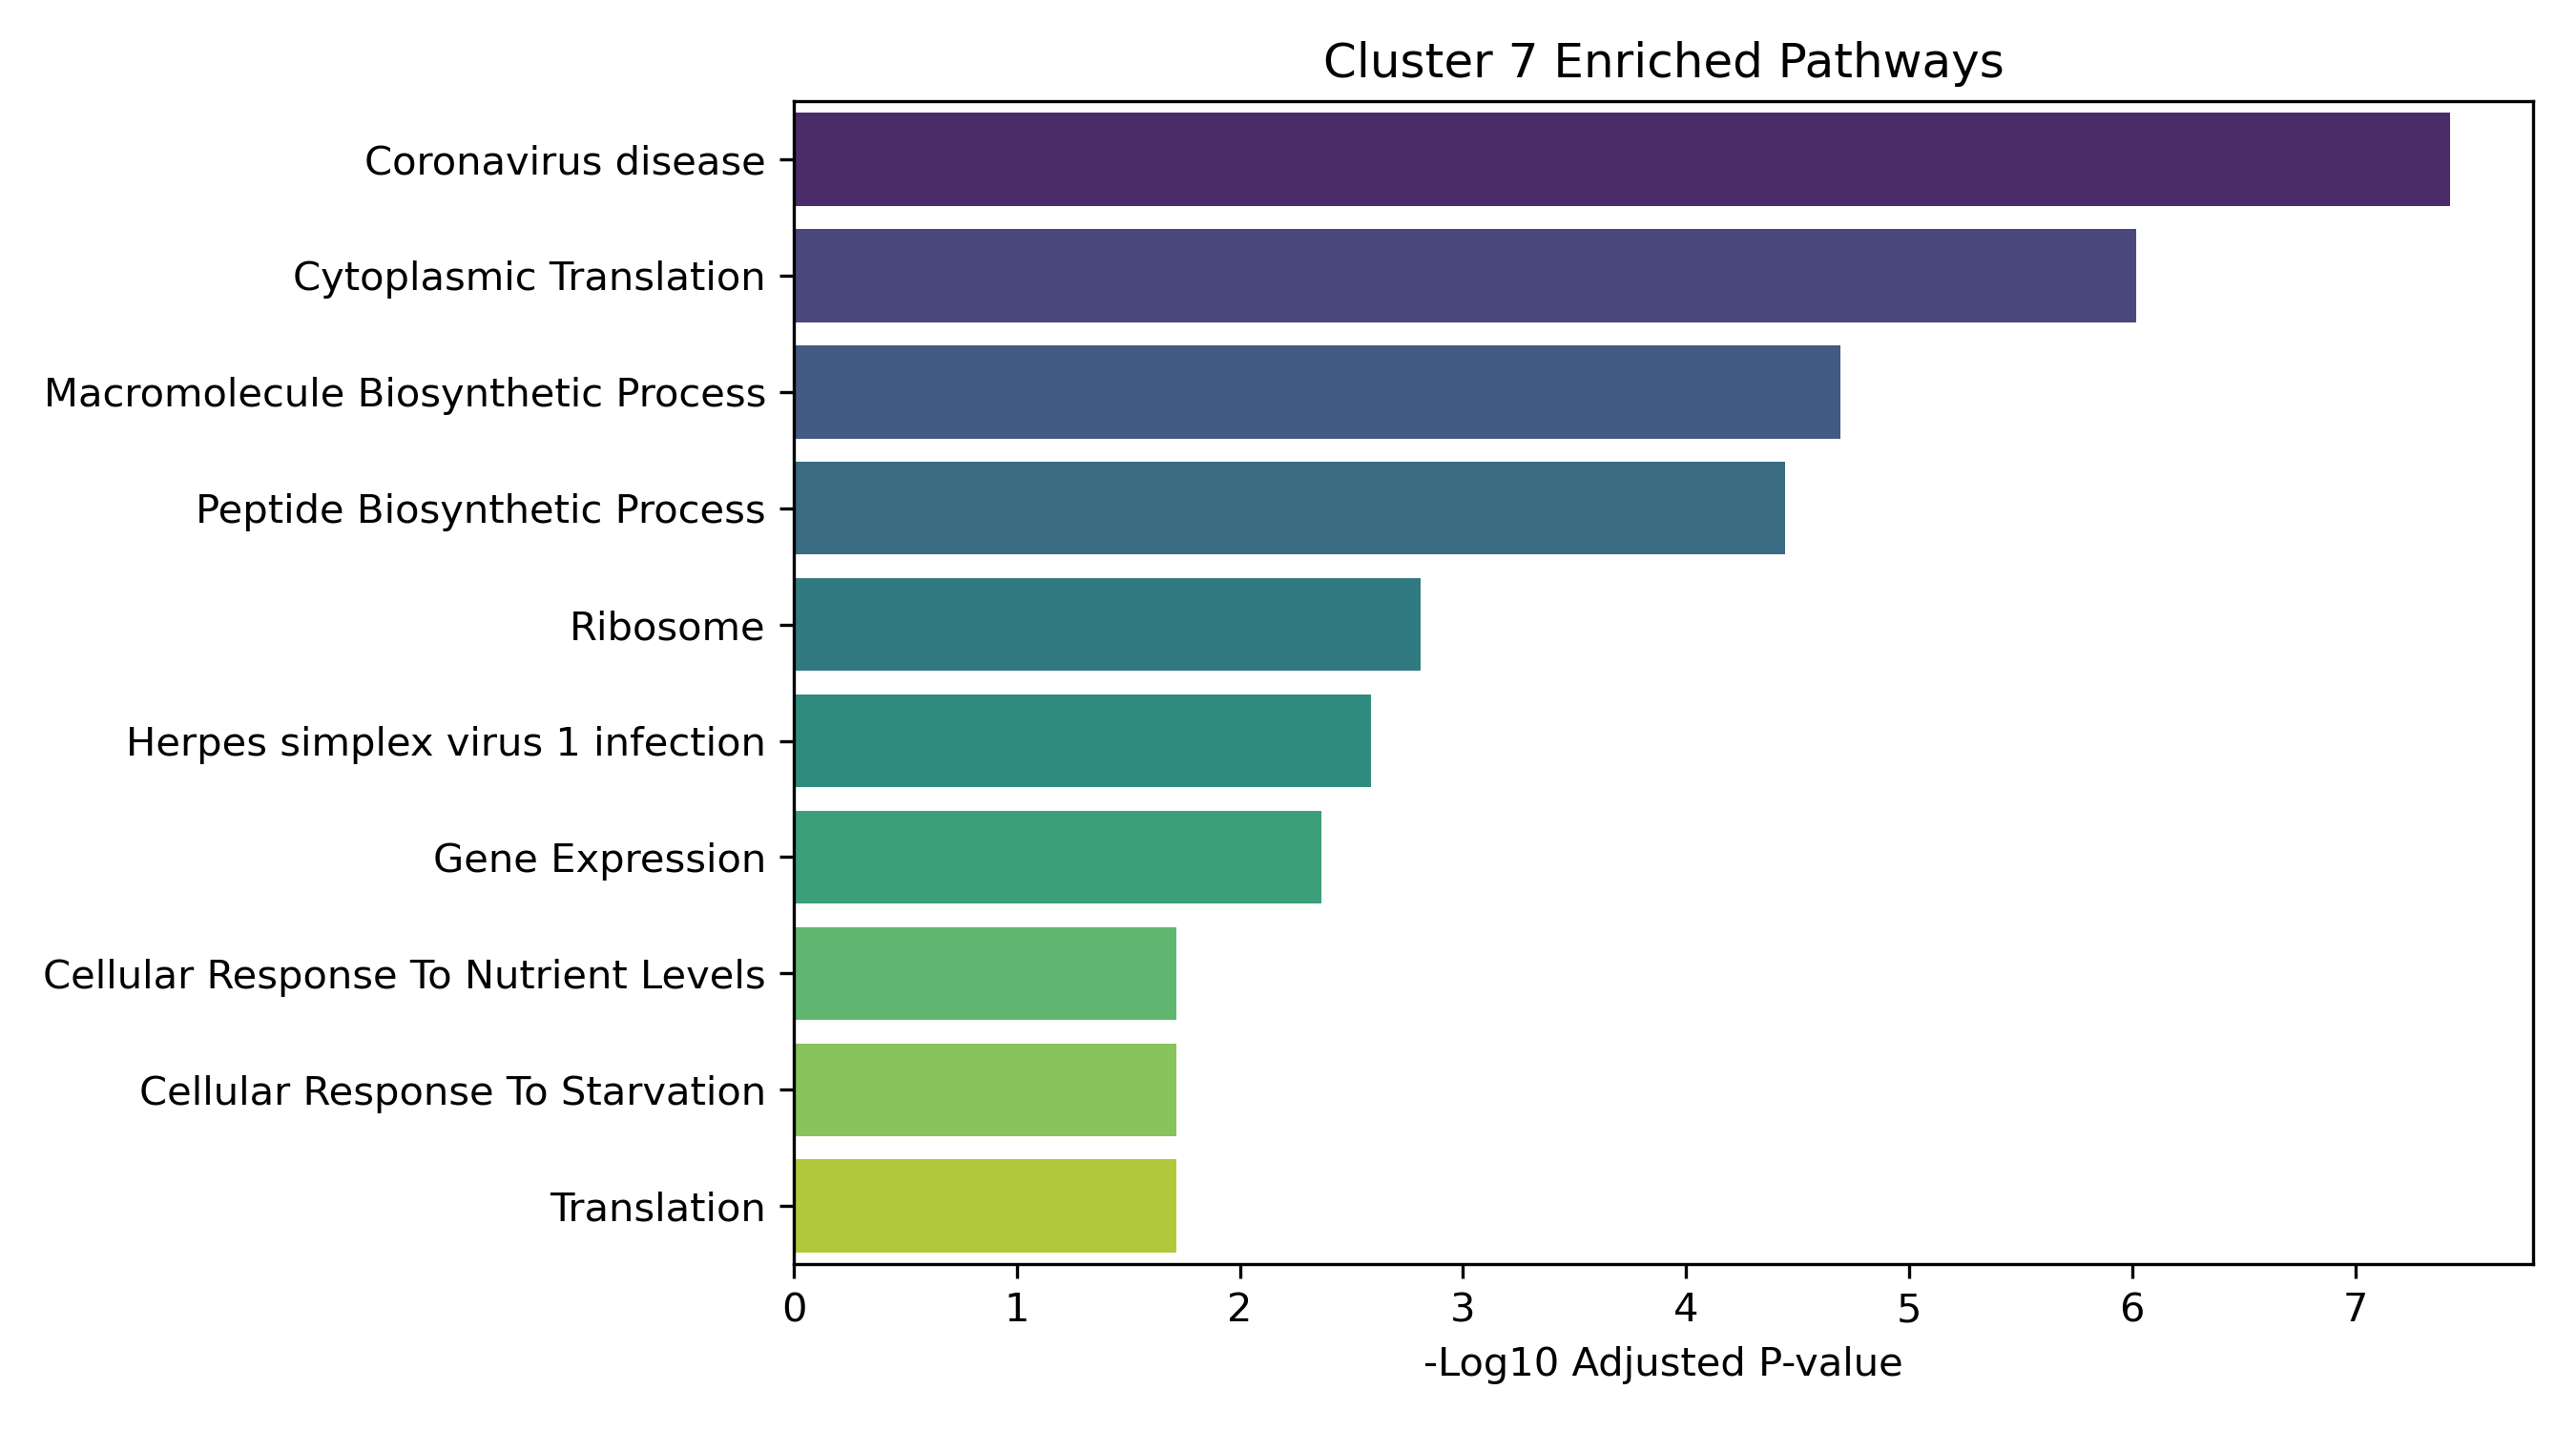
- Enrichment Bar Plots: Shows biological processes (GO/KEGG) enriched in that specific cluster. This identifies the molecular functions tied to each expression trajectory.
Epigenetic & HDACi Signatures
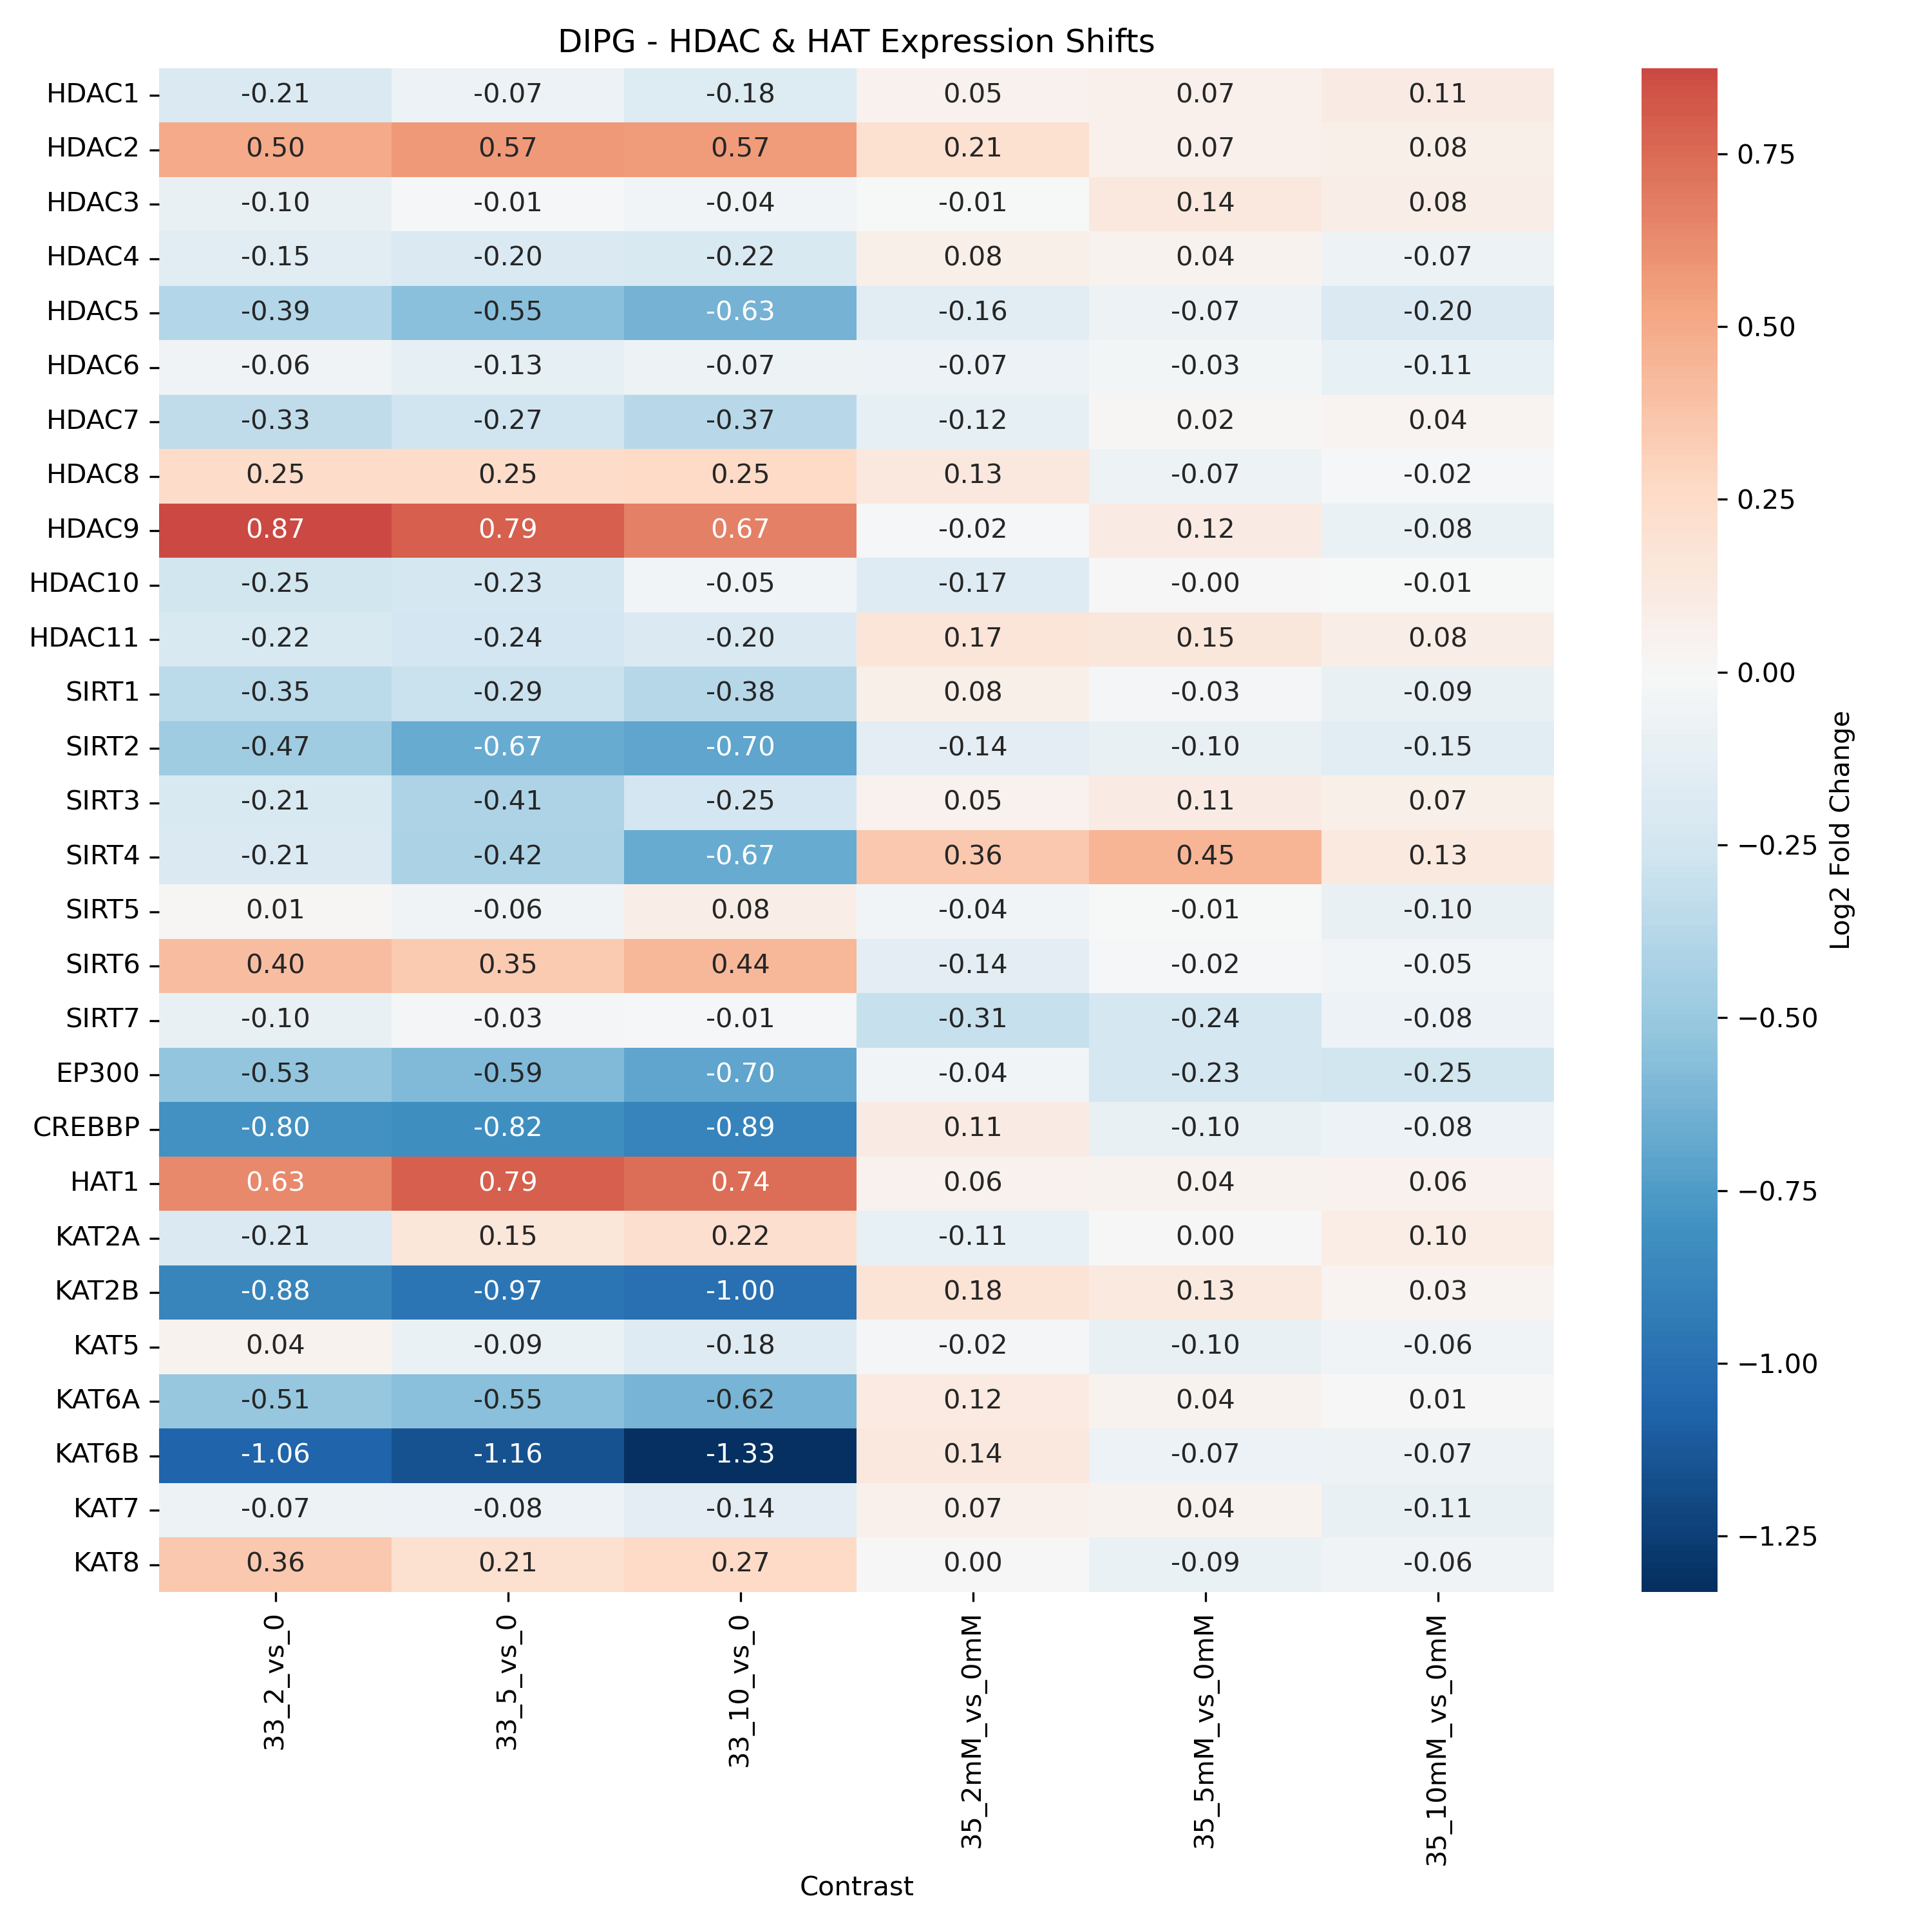
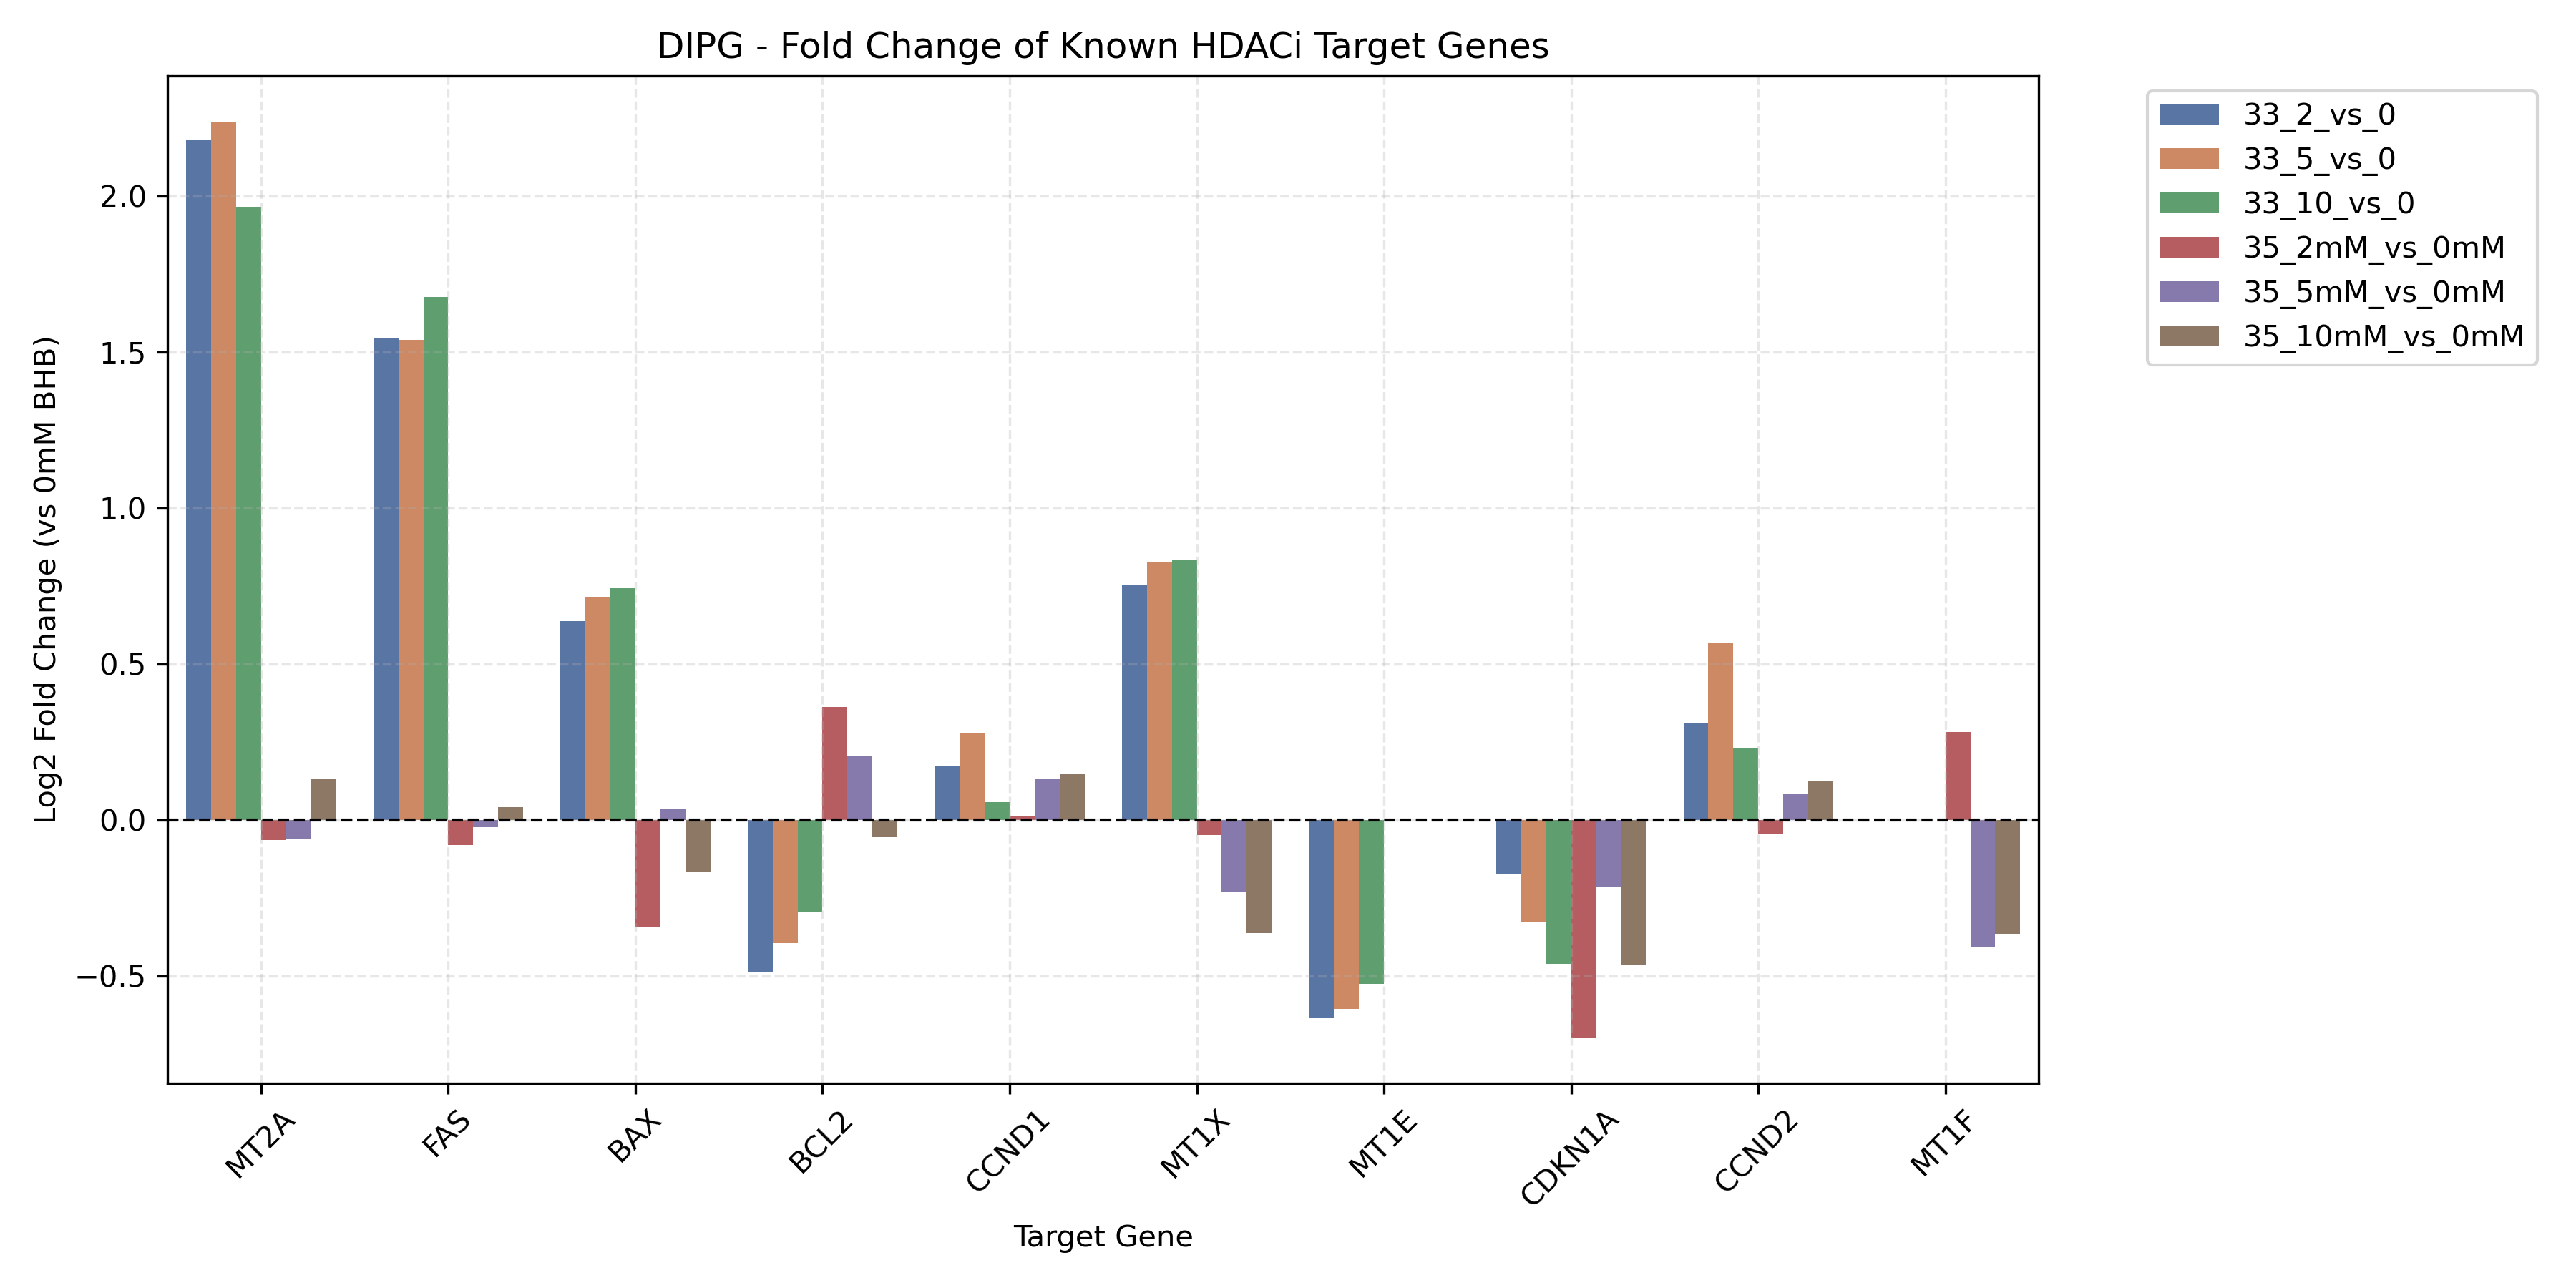
Profiles transcriptional shifts in Histone Deacetylases (HDACs), Histone Acetyltransferases (HATs), and classic downstream targets of HDAC inhibitors (like CDKN1A (p21) and metallothioneins) to assess epigenetic regulation by BHB.
Unified Epigenetic Regulation Heatmap & Target Activation
Cell Line-Specific Epigenetic Volcano Plots (Highest Dose)
Dynamic Epigenetics Gene Dose-Response Viewer
- 📄 demo_epigenetic_signatures.csv (LFC & P-values)
⚙️ Pipeline Logic (src/hdac_signature_analysis.py):
- Signature Filtering: Subsets DGE results to predefined gene lists: HDACs (HDAC1-11, SIRT1-7), HATs (EP300, CREBBP, KATs), and canonical downstream target genes of HDAC inhibitors (e.g.,
CDKN1A,CCND1, metallothioneins). - Data Compilation: Merges log2FC, p-value, and adjusted p-value metrics for these genes across all contrasts and cell lines into a unified project dataframe.
- Heatmap & Bar Plot Creation:
- Generates a combined heatmap of HDAC/HAT Log2FC values across all cell lines (grouped by cell line and ordered by dose) to trace how epigenetic writers and erasers adapt across treatment concentrations.
- Generates a combined bar plot showing dose-dependent fold changes of canonical HDACi target genes across all contrasts.
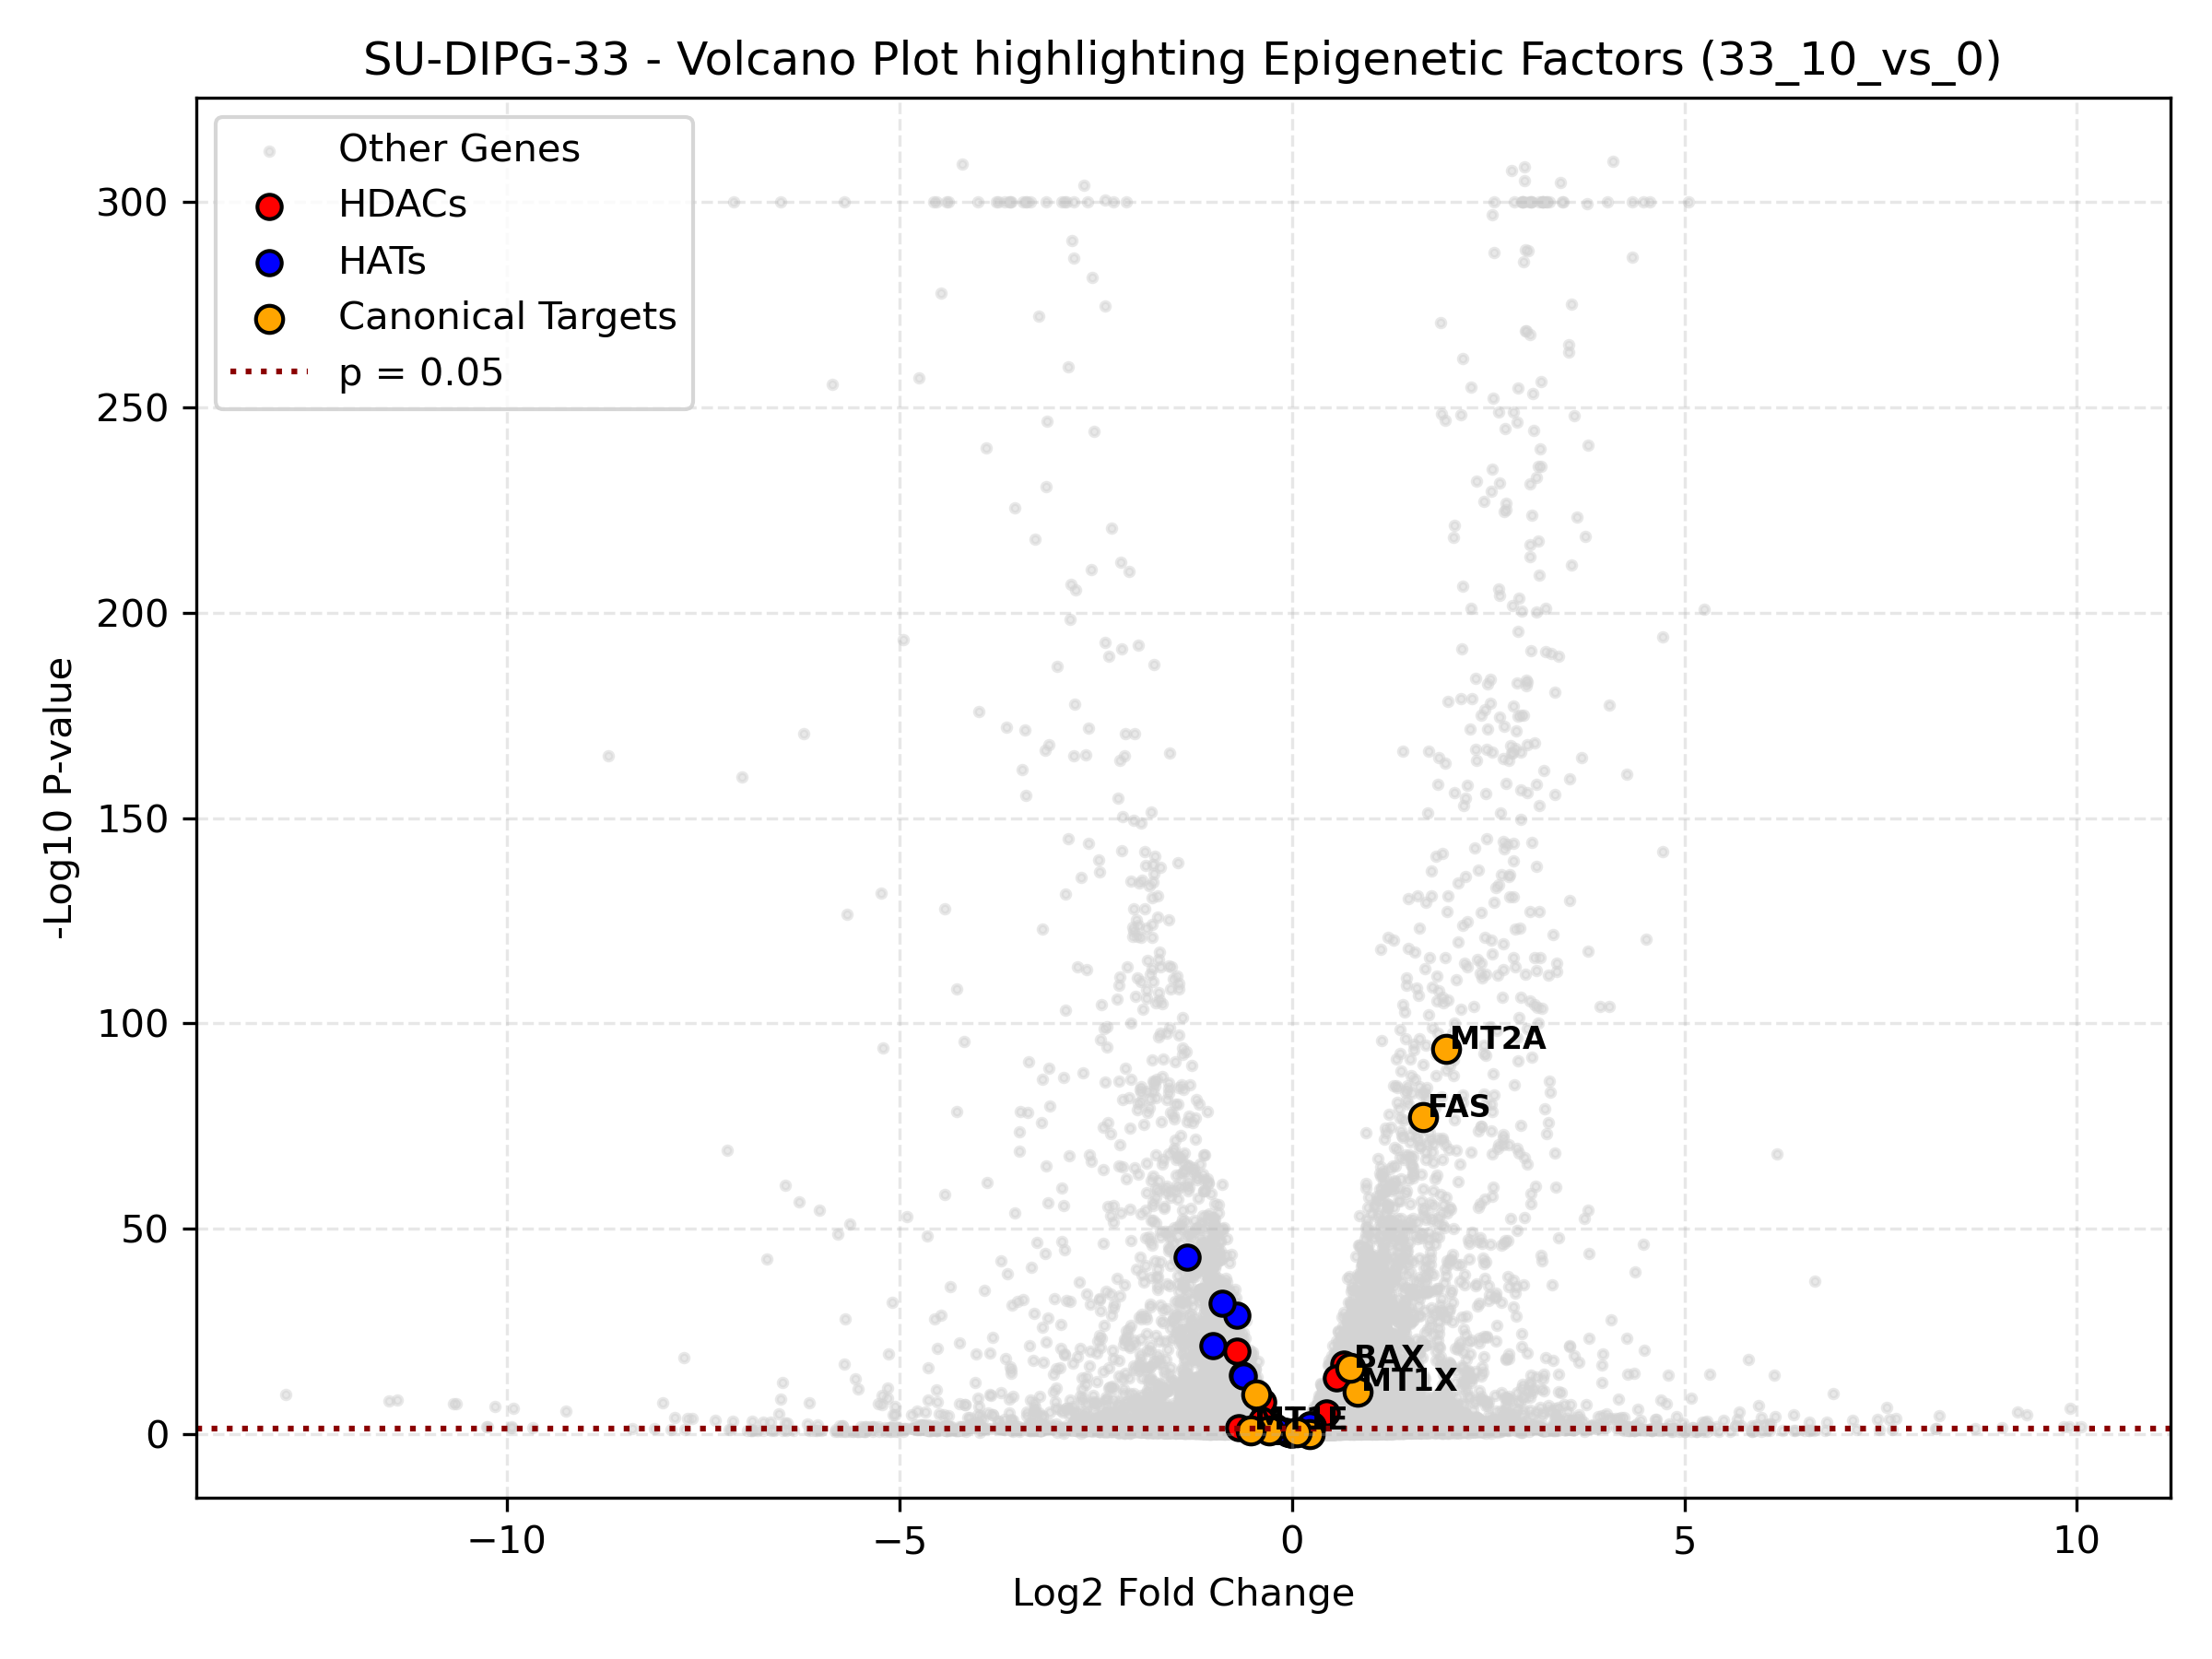
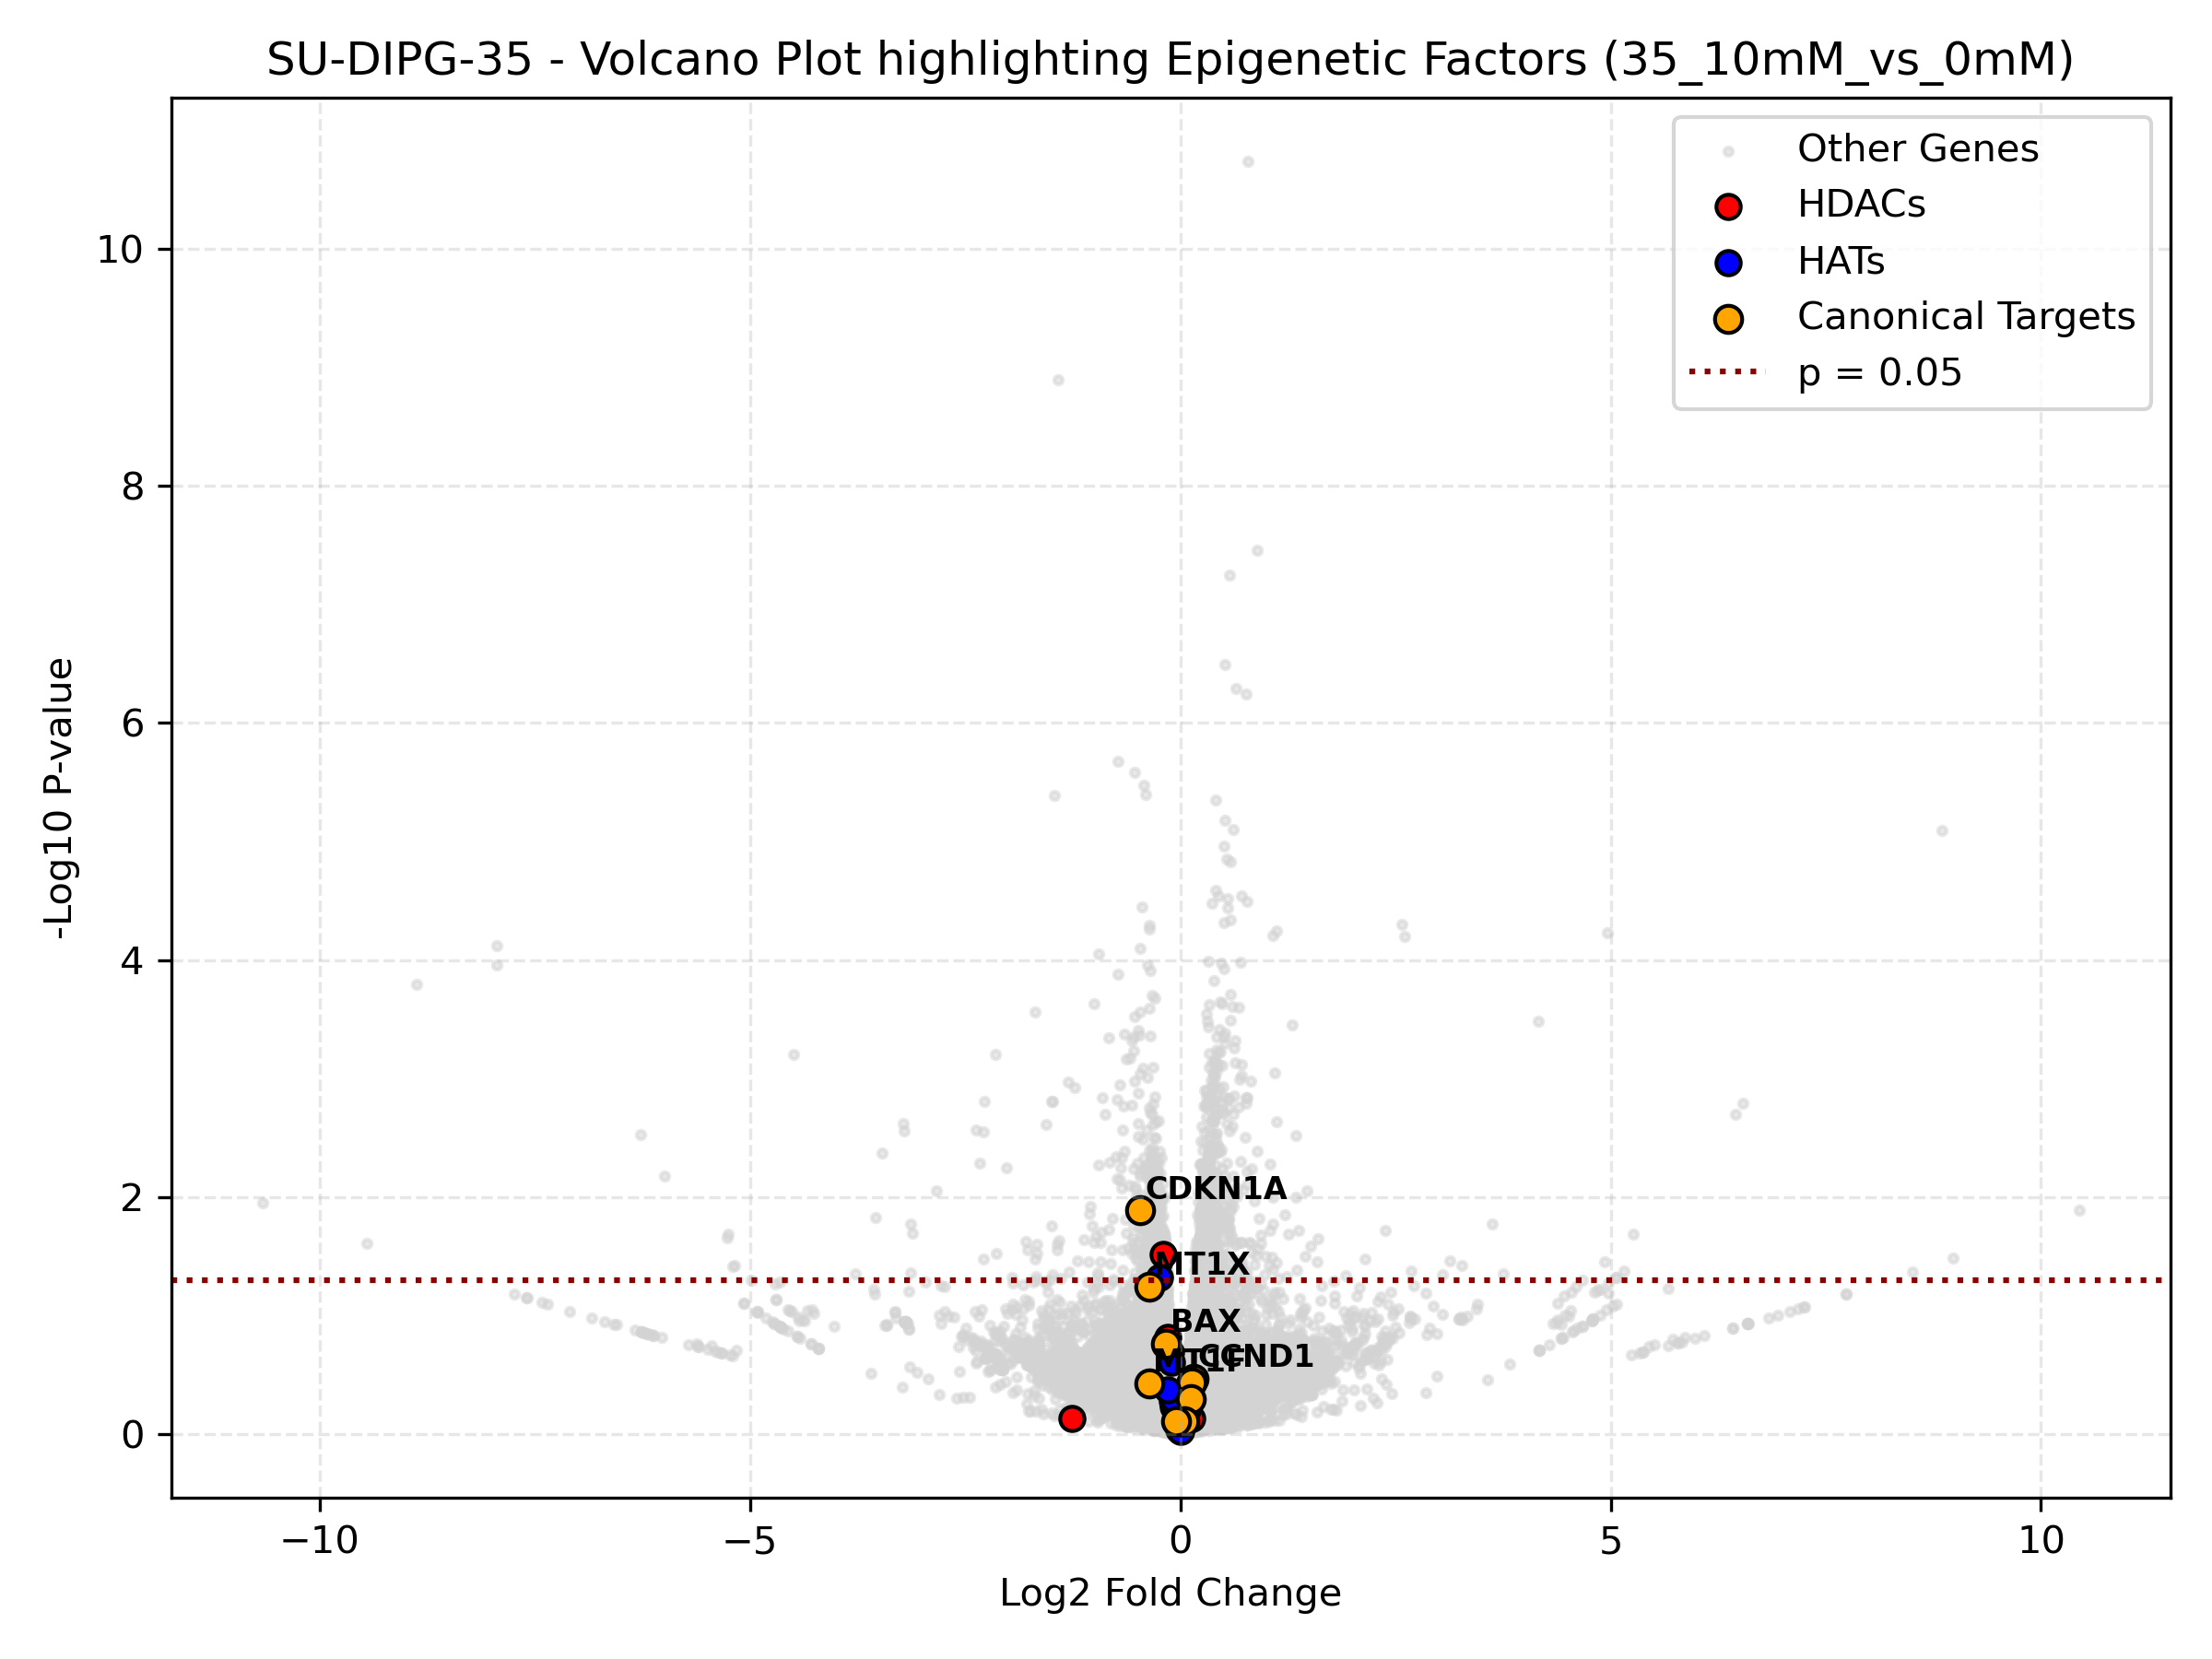
- Targeted Volcano: Draws individual cell line volcano plots for their highest dose contrast (10mM) highlighting epigenetic regulators and targets.
💡 How to Interpret Epigenetic Profiling:
- HDAC / HAT Heatmap: Shows if BHB suppresses or activates expression of Histone Deacetylases (HDACs) and Histone Acetyltransferases (HATs). Red blocks represent upregulation, while blue blocks represent downregulation. A feedback loop is often observed where cells respond to HDAC inhibition by modifying epigenetic enzymes.
- Canonical Target Activation: HDAC inhibitors historically activate the cell cycle inhibitor *CDKN1A* (p21) and the Metallothionein gene family (*MT1A*, *MT2A*, etc.). If BHB successfully acts as an endogenous HDAC inhibitor, we expect strong, dose-dependent upregulation of these genes.
- Epigenetic Volcano: Highlights the statistical significance of epigenetic factors (HDACs = red, HATs = blue, Targets = orange) compared to the rest of the transcriptome. If orange target dots are far to the right, it represents strong transcriptional activation.
Mitochondrial Health & Bioenergetics
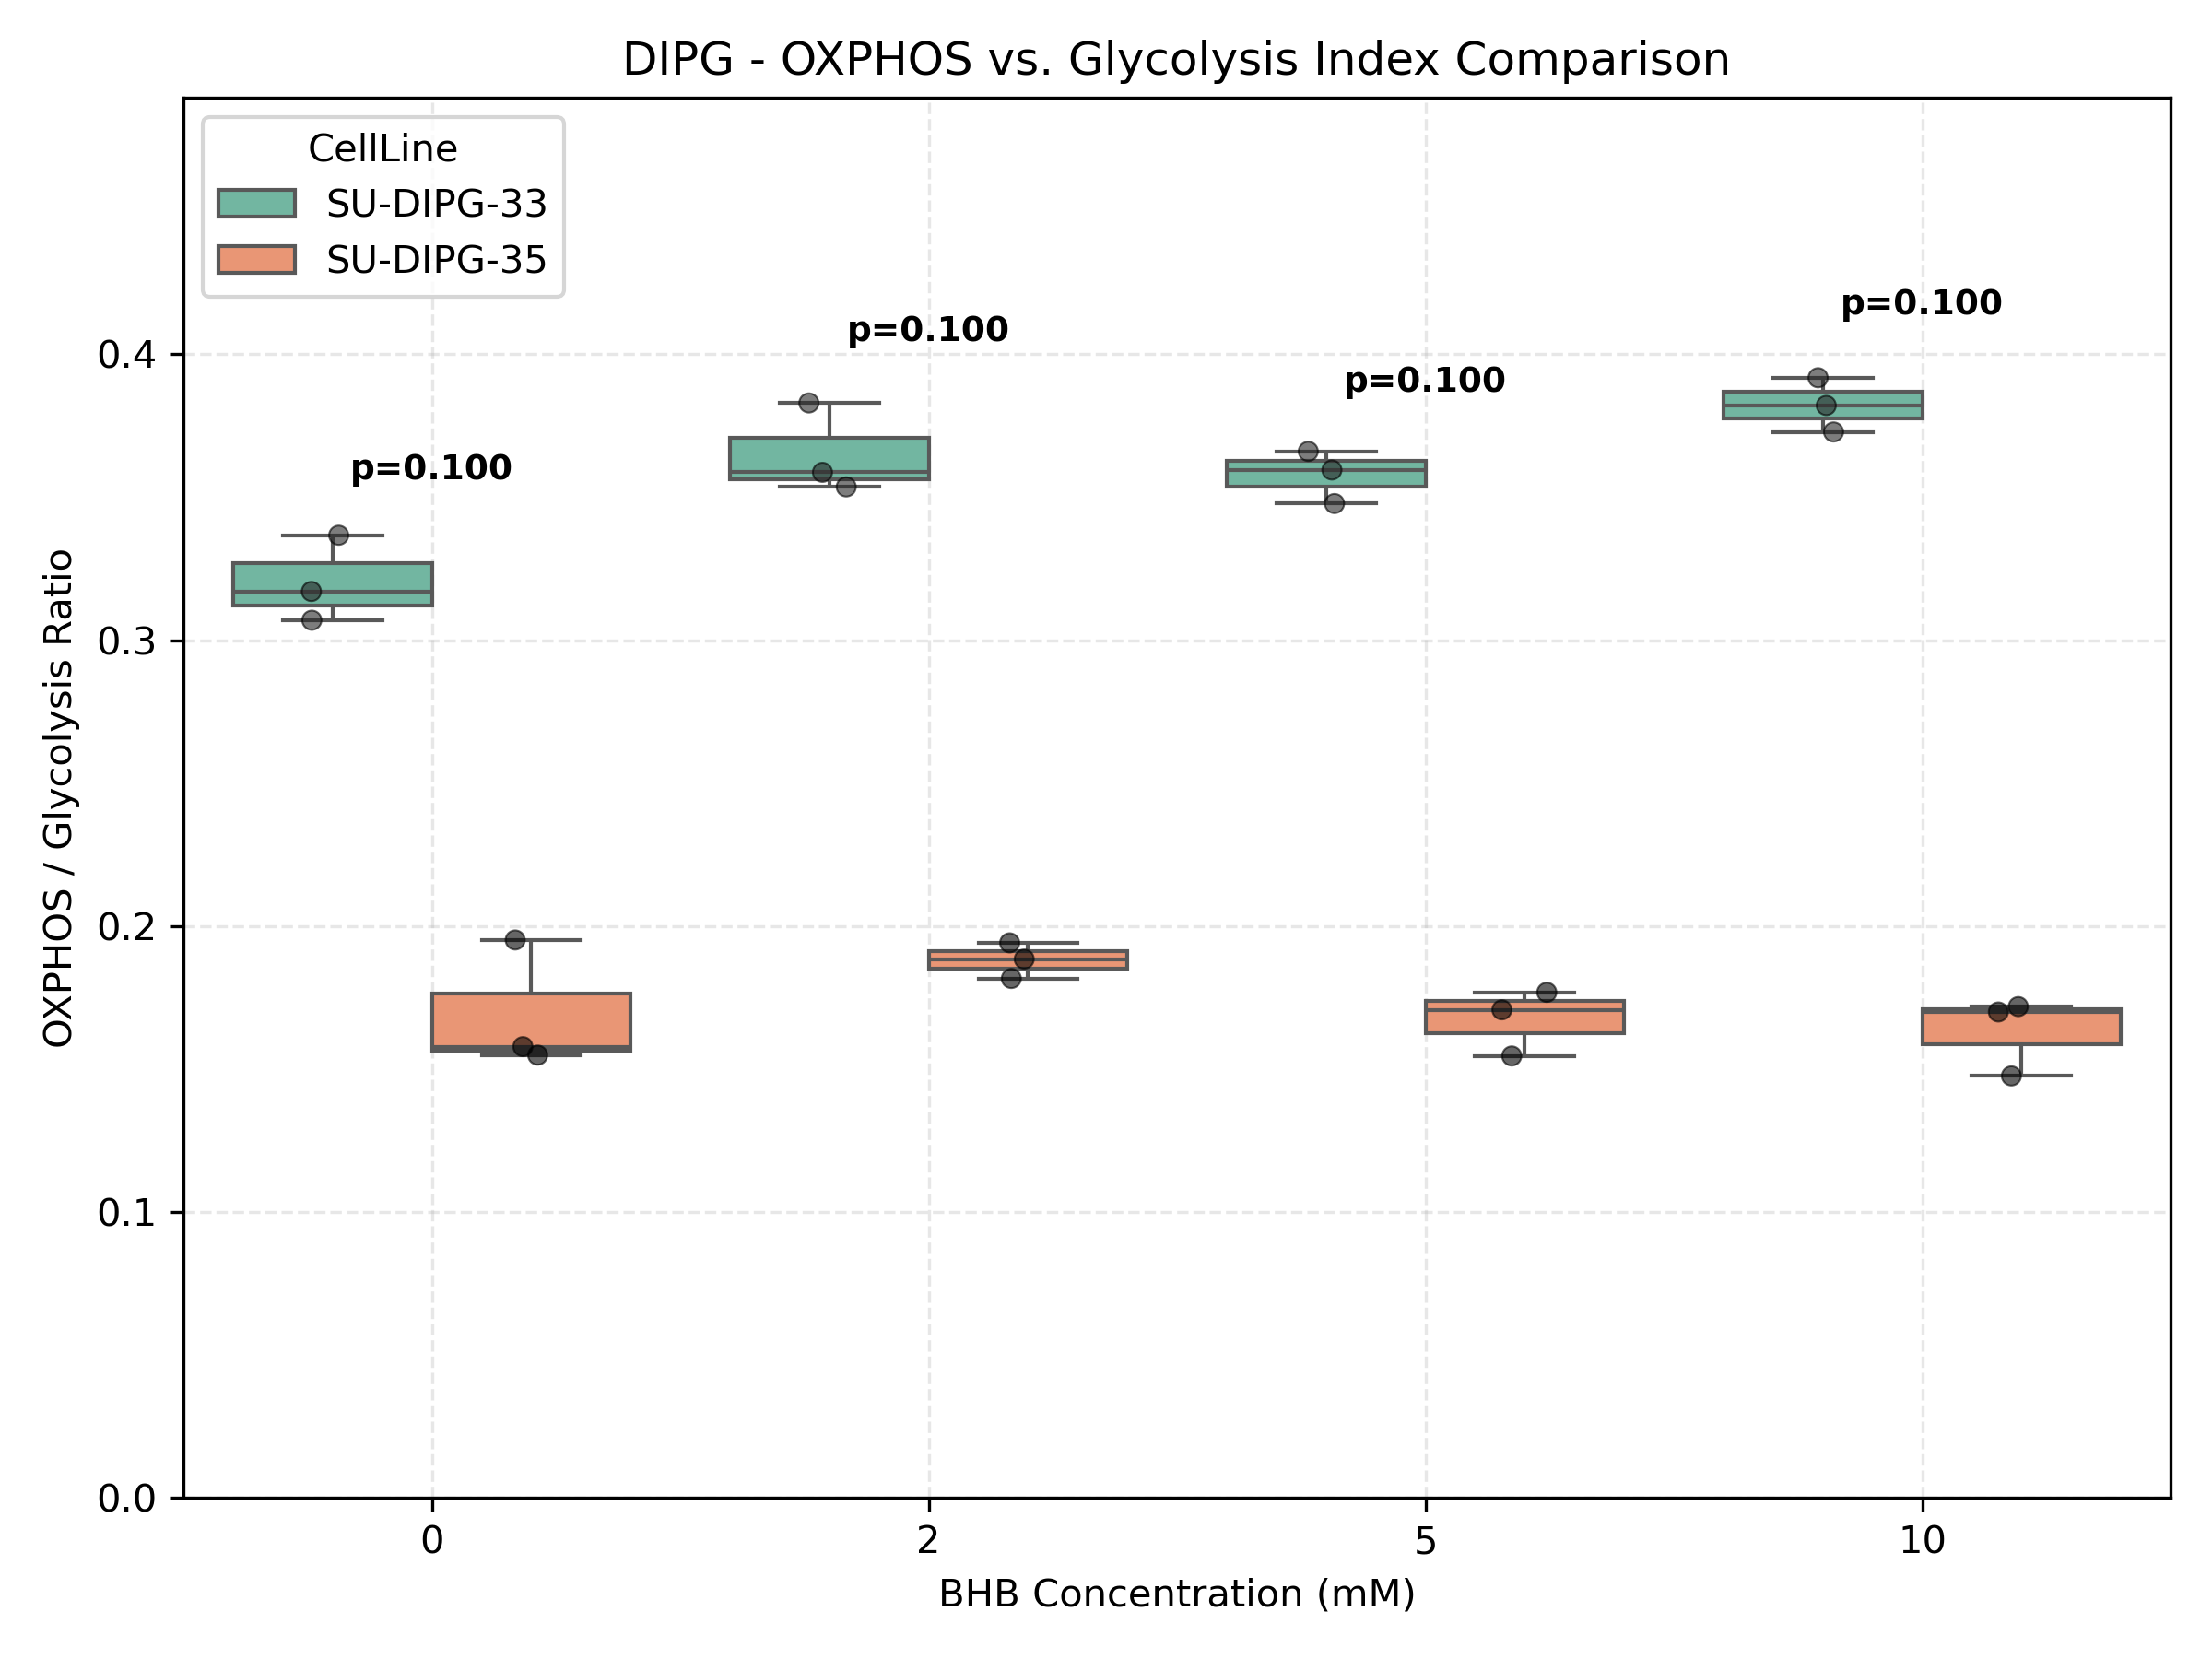
Calculates the commitments of samples to Oxidative Phosphorylation (OXPHOS) vs. Glycolysis and profiles mitochondrial network remodeling (Fission vs Fusion) and antioxidant responses.
Unified Mitochondrial Bioenergetics & Dynamics Comparison
Dynamic Bioenergetic & Dynamics Gene Dose-Response Viewer
- 📄 demo_bioenergetic_indices.csv (Sample Indices)
⚙️ Pipeline Logic (src/mitochondrial_analysis.py):
- OXPHOS-vs-Glycolysis Index:
- Filters the TPM expression matrix for 11 core glycolysis genes and 30+ OXPHOS genes (Complexes I-V).
- Computes the mean expression of OXPHOS and glycolysis genes for each sample.
- Calculates the bioenergetic index as:
OXPHOS_Mean / Glycolysis_Mean. - Merges all indexes into a unified project dataset and plots them side-by-side using different color fills for cell lines. Runs Mann-Whitney U test comparing the cell lines at each concentration.
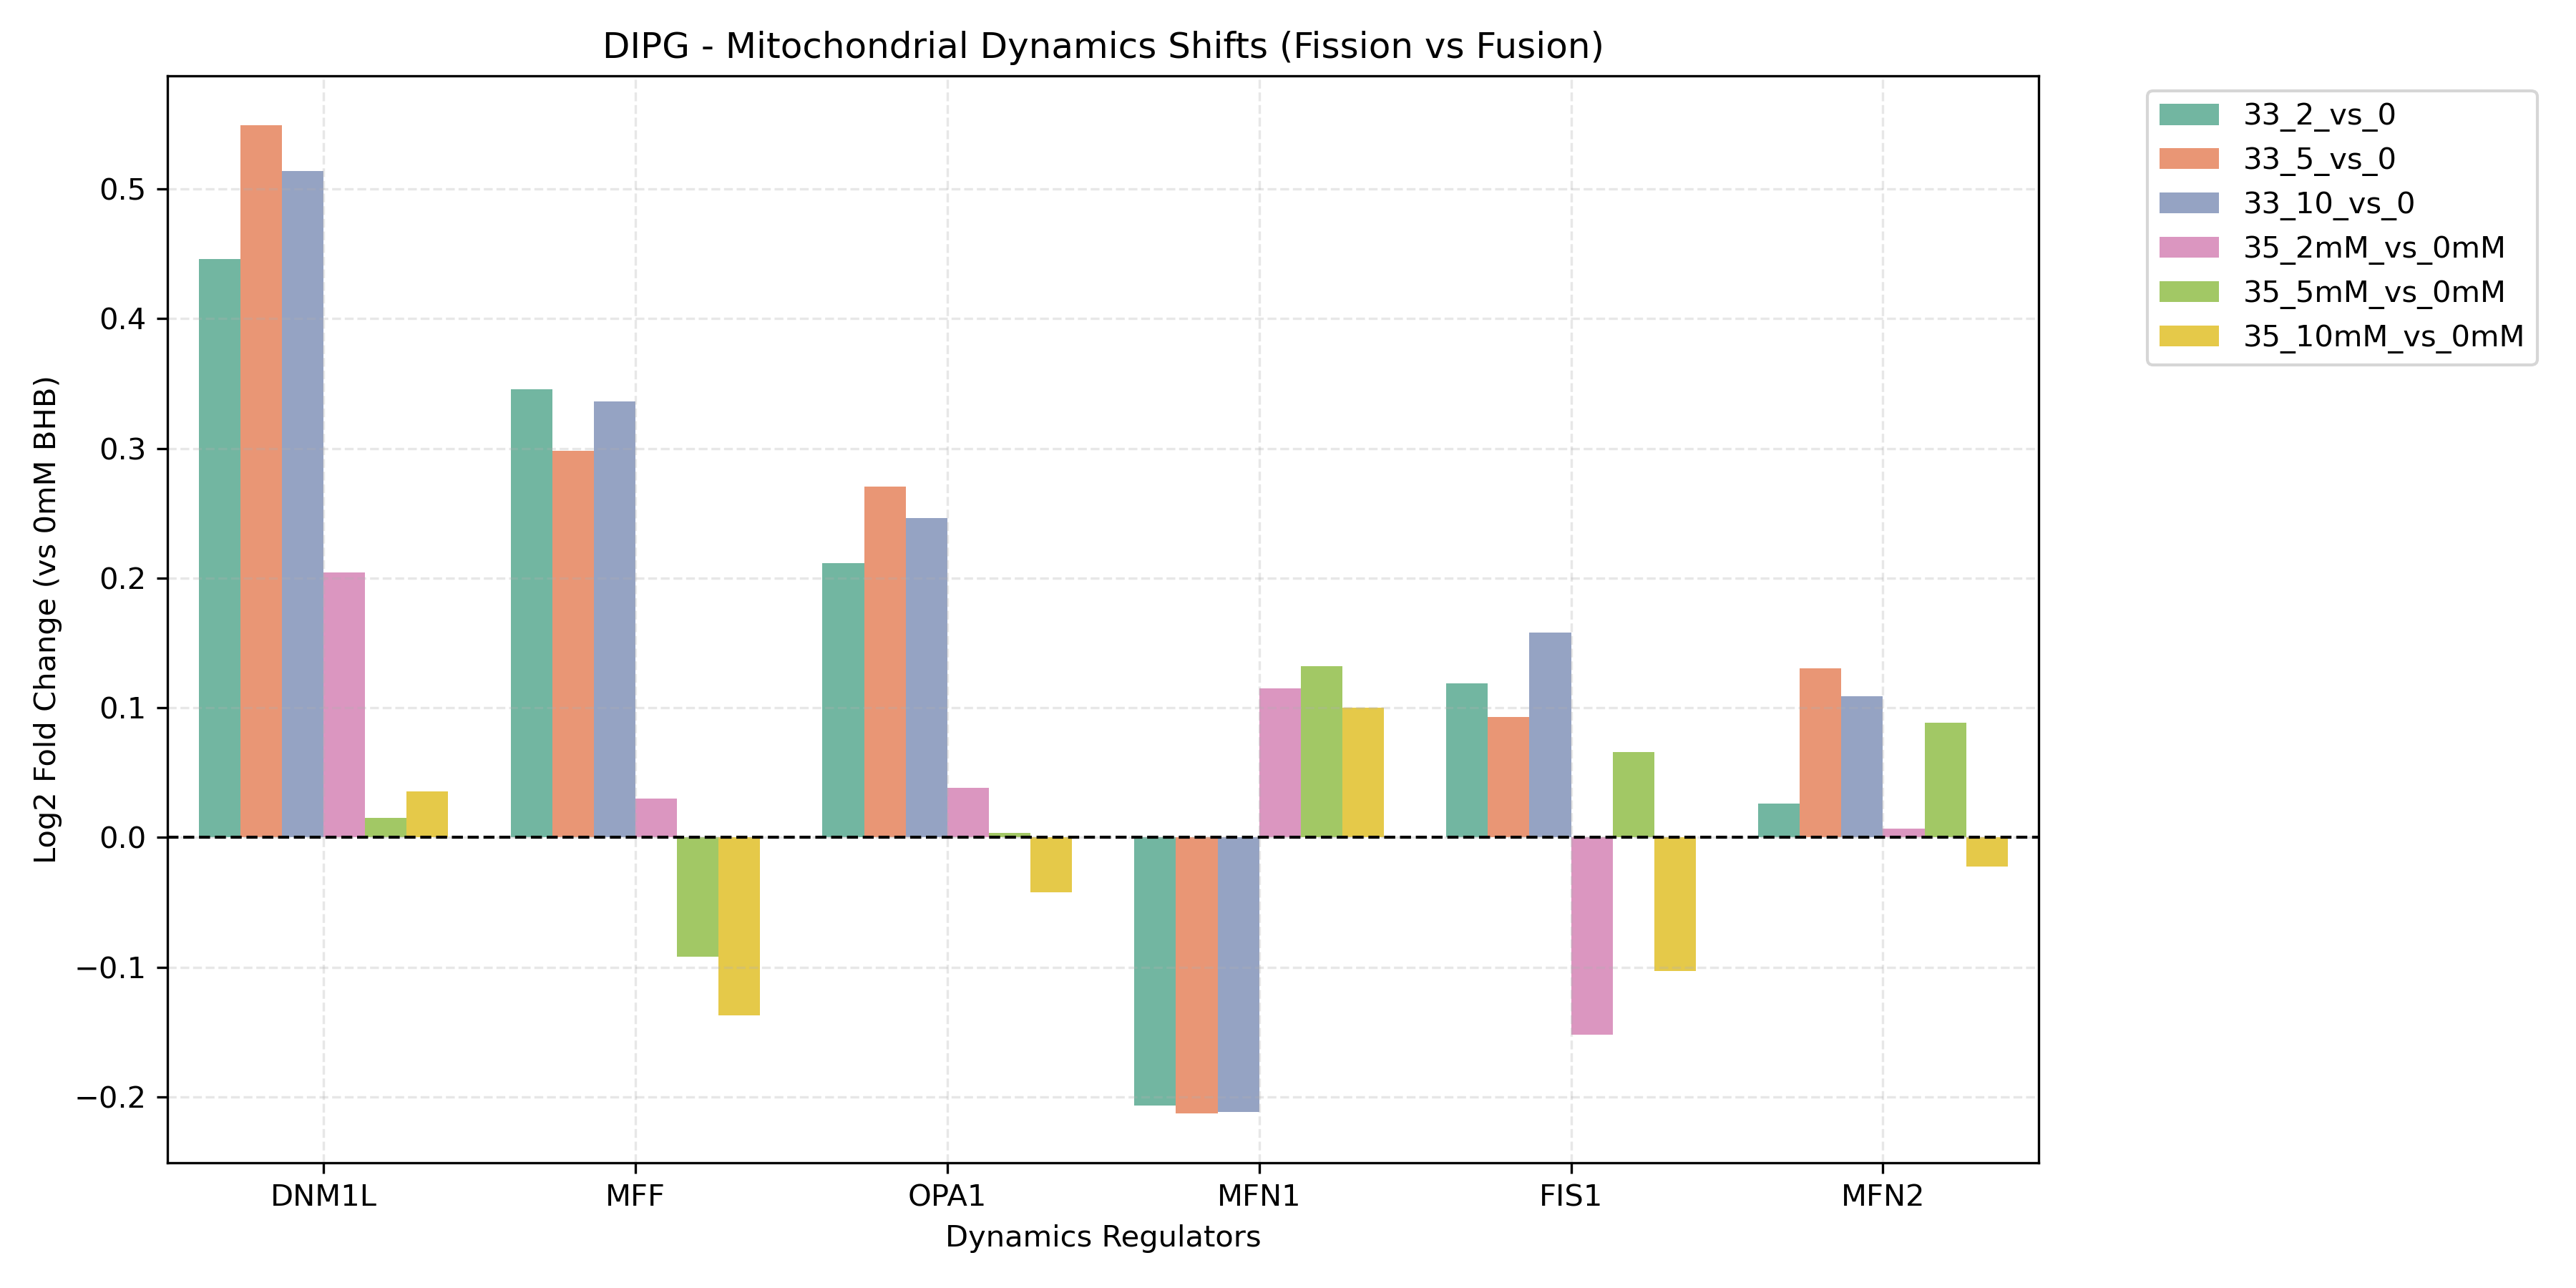
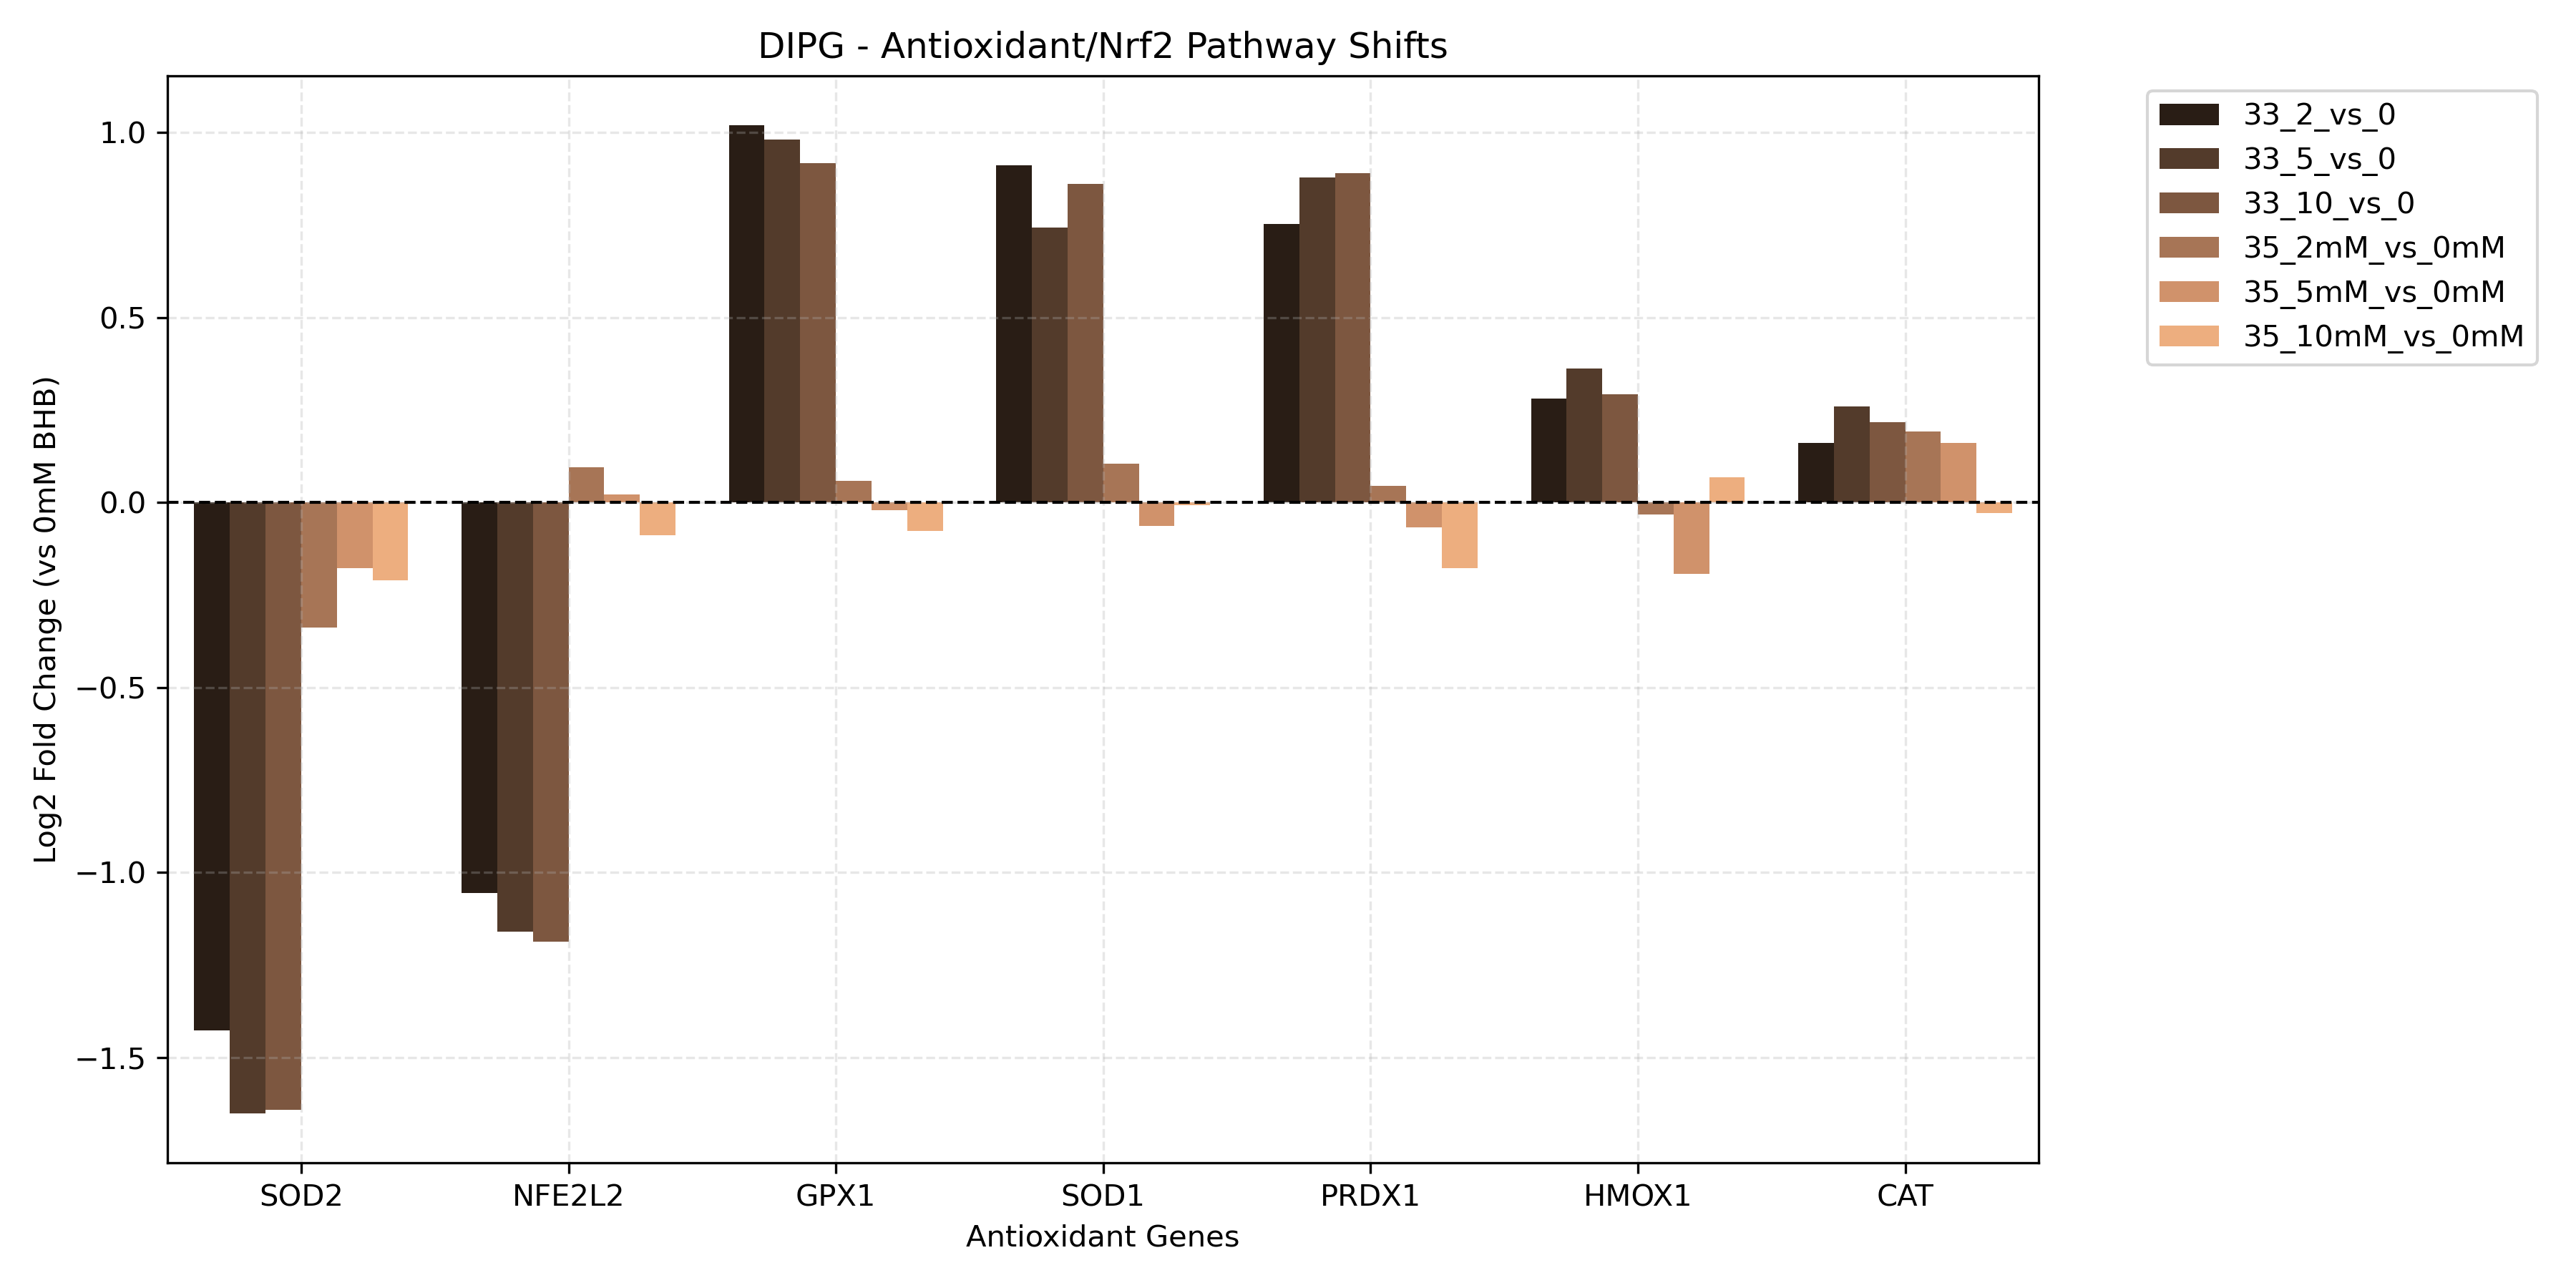
- Dynamics and Antioxidant Response:
- Reads contrast-specific DGE results to retrieve Log2FC values for mitochondrial fusion genes (
MFN1,MFN2,OPA1), fission genes (DNM1L,FIS1,MFF), and Nrf2 antioxidant response genes (SOD1,SOD2,CAT,GPX1,PRDX1,NFE2L2,HMOX1). - Generates unified project-level bar charts comparing these values across all sorted contrasts to profile mitochondrial structural dynamics and oxidative stress responses.
- Reads contrast-specific DGE results to retrieve Log2FC values for mitochondrial fusion genes (
💡 How to Interpret Bioenergetic Profiling:
- OXPHOS vs. Glycolysis Index: Computes the ratio of the average expression of 30+ OXPHOS genes (Complexes I-V) vs. 11 core Glycolysis genes.
- DIPG (Glioma): Gliomas generally commit to glycolysis (Warburg effect). An increase in the index after BHB treatment suggests a metabolic shift forcing cells towards mitochondrial respiration. This metabolic reprogramming often triggers reactive oxygen species (ROS) and suppresses growth in glycolytic glioma lines.
- Autism Fibroblasts: Fibroblasts from autism patients often present baseline mitochondrial dysfunction. A recovery in this index indicates a rescue effect where BHB restores mitochondrial bioenergetics.
- Mitochondrial Dynamics: Plots fission genes (*DNM1L/Drp1*, *FIS1*) vs fusion genes (*MFN1*, *MFN2*, *OPA1*).
- High Fission / Low Fusion: Indicates mitochondrial network fragmentation (associated with mitophagy, cell division, or high stress).
- Low Fission / High Fusion: Indicates mitochondrial network elongation (associated with high OXPHOS efficiency and healthy respiration).
- Antioxidant Response: Measures Nrf2 target activation (*SOD2*, *CAT*, *GPX1*, *HMOX1*). Significant upregulation suggests that BHB either triggers mitochondrial ROS (inducing stress defenses) or actively triggers an antioxidant signaling cascade to protect against oxidative damage.
Pathway Enrichment
Identifies biological processes and pathways enriched in differentially expressed genes using GSEA and GSVA.
Pathway Summary Log
Pathway Enrichment Summary
Gene sets: ['GO_Biological_Process_2026', 'KEGG_2026']
Methods: ['gsea', 'gsva']
============================================================
Contrast: 35_10mM_vs_0mM
Genes ranked: 28314
Gene sets tested: 2947
Significant terms (FDR ≤ 0.05): 18
- GO_Biological_Process_2026__Positive Regulation of Immune System Process (GO:0002684) NES=-2.029 FDR=0.0140
- GO_Biological_Process_2026__Antigen Processing and Presentation of Peptide Antigen via MHC Class II (GO:0002495) NES=-2.027 FDR=0.0074
- GO_Biological_Process_2026__Antigen Processing and Presentation of Exogenous Peptide Antigen (GO:0002478) NES=-2.012 FDR=0.0078
- KEGG_2026__PROTEASOME NES=1.991 FDR=0.0122
- GO_Biological_Process_2026__Peptide Antigen Assembly With MHC Protein Complex (GO:0002501) NES=-1.985 FDR=0.0138
- GO_Biological_Process_2026__Positive Regulation of T Cell Mediated Immunity (GO:0002711) NES=-1.976 FDR=0.0146
- GO_Biological_Process_2026__Antigen Processing and Presentation of Exogenous Peptide Antigen via MHC Class II (GO:0019886) NES=-1.964 FDR=0.0154
- KEGG_2026__AUTOIMMUNE THYROID DISEASE NES=-1.958 FDR=0.0063
- KEGG_2026__ANTIGEN PROCESSING AND PRESENTATION NES=-1.947 FDR=0.0038
- GO_Biological_Process_2026__Positive Regulation of Response to Stimulus (GO:0048584) NES=-1.908 FDR=0.0392
Contrast: 33_5_vs_0
Genes ranked: 25916
Gene sets tested: 2899
Significant terms (FDR ≤ 0.05): 177
- GO_Biological_Process_2026__Mitotic Sister Chromatid Segregation (GO:0000070) NES=2.921 FDR=0.0010
- GO_Biological_Process_2026__DNA Replication (GO:0006260) NES=2.715 FDR=0.0010
- GO_Biological_Process_2026__Sister Chromatid Segregation (GO:0000819) NES=2.702 FDR=0.0010
- GO_Biological_Process_2026__Mitotic Nuclear Division (GO:0140014) NES=2.655 FDR=0.0010
- KEGG_2026__CELL CYCLE NES=2.595 FDR=0.0010
- GO_Biological_Process_2026__Mitotic Metaphase Chromosome Alignment (GO:0007080) NES=2.584 FDR=0.0010
- GO_Biological_Process_2026__Mitotic Spindle Organization (GO:0007052) NES=2.584 FDR=0.0010
- GO_Biological_Process_2026__Microtubule Cytoskeleton Organization Involved in Mitosis (GO:1902850) NES=2.549 FDR=0.0010
- GO_Biological_Process_2026__Negative Regulation of Mitotic Metaphase/Anaphase Transition (GO:0045841) NES=2.507 FDR=0.0010
- GO_Biological_Process_2026__DNA Metabolic Process (GO:0006259) NES=2.500 FDR=0.0010
Contrast: 33_10_vs_0
Genes ranked: 26493
Gene sets tested: 2904
Significant terms (FDR ≤ 0.05): 157
- GO_Biological_Process_2026__Mitotic Sister Chromatid Segregation (GO:0000070) NES=2.840 FDR=0.0010
- GO_Biological_Process_2026__Sister Chromatid Segregation (GO:0000819) NES=2.673 FDR=0.0010
- GO_Biological_Process_2026__DNA Replication (GO:0006260) NES=2.654 FDR=0.0010
- GO_Biological_Process_2026__Mitotic Nuclear Division (GO:0140014) NES=2.625 FDR=0.0010
- GO_Biological_Process_2026__Mitotic Spindle Organization (GO:0007052) NES=2.527 FDR=0.0010
- GO_Biological_Process_2026__Microtubule Cytoskeleton Organization Involved in Mitosis (GO:1902850) NES=2.500 FDR=0.0010
- GO_Biological_Process_2026__Negative Regulation of Mitotic Metaphase/Anaphase Transition (GO:0045841) NES=2.487 FDR=0.0010
- GO_Biological_Process_2026__Cell Cycle G2/M Phase Transition (GO:0044839) NES=2.476 FDR=0.0010
- KEGG_2026__CELL CYCLE NES=2.468 FDR=0.0010
- GO_Biological_Process_2026__DNA Metabolic Process (GO:0006259) NES=2.462 FDR=0.0010
Contrast: 33_2_vs_0
Genes ranked: 25997
Gene sets tested: 2890
Significant terms (FDR ≤ 0.05): 169
- GO_Biological_Process_2026__Mitotic Sister Chromatid Segregation (GO:0000070) NES=2.949 FDR=0.0010
- GO_Biological_Process_2026__Sister Chromatid Segregation (GO:0000819) NES=2.678 FDR=0.0010
- GO_Biological_Process_2026__Mitotic Nuclear Division (GO:0140014) NES=2.663 FDR=0.0010
- GO_Biological_Process_2026__Mitotic Spindle Organization (GO:0007052) NES=2.623 FDR=0.0010
- GO_Biological_Process_2026__DNA Replication (GO:0006260) NES=2.613 FDR=0.0010
- KEGG_2026__CELL CYCLE NES=2.603 FDR=0.0010
- GO_Biological_Process_2026__Mitotic Metaphase Chromosome Alignment (GO:0007080) NES=2.578 FDR=0.0010
- GO_Biological_Process_2026__Intermediate Filament Organization (GO:0045109) NES=-2.546 FDR=0.0010
- GO_Biological_Process_2026__Microtubule Cytoskeleton Organization Involved in Mitosis (GO:1902850) NES=2.543 FDR=0.0010
- GO_Biological_Process_2026__Negative Regulation of Mitotic Metaphase/Anaphase Transition (GO:0045841) NES=2.511 FDR=0.0010
Contrast: 35_2mM_vs_0mM
Genes ranked: 28274
Gene sets tested: 2948
Significant terms (FDR ≤ 0.05): 4
- GO_Biological_Process_2026__Spliceosomal Conformational Changes to Generate Catalytic Conformation (GO:0000393) NES=2.153 FDR=0.0353
- GO_Biological_Process_2026__Spliceosome Conformational Change to Release U4 (Or U4atac) and U1 (Or U11) (GO:0000388) NES=2.147 FDR=0.0201
- GO_Biological_Process_2026__Spliceosomal tri-snRNP Complex Assembly (GO:0000244) NES=2.142 FDR=0.0145
- GO_Biological_Process_2026__RNA Splicing, via Transesterification Reactions (GO:0000375) NES=2.089 FDR=0.0390
Contrast: 35_5mM_vs_0mM
Genes ranked: 27813
Gene sets tested: 2934
Significant terms (FDR ≤ 0.05): 2
- GO_Biological_Process_2026__Skin Development (GO:0043588) NES=-1.894 FDR=0.0478
- GO_Biological_Process_2026__RNA Polymerase II Transcription Initiation Surveillance (GO:0160240) NES=-1.861 FDR=0.0487
Dynamic Pathway Dose-Response Viewer
⚙️ Pipeline Logic (src/pathway_enrichment.py & src/export_pathway_json.py):
- GSEA Prerank (
src/pathway_enrichment.py): Ranks all annotated genes in a contrast bylog2FoldChangein descending order. Runsgseapy.prerankagainst reference databases (e.g.GO_Biological_Process_2025) using 1000 random permutations to calculate enrichment scores (ES), normalized enrichment scores (NES), and false discovery rate (FDR). - GSVA (
src/pathway_enrichment.py): Computes sample-level pathway enrichment scores from raw expression matrices using GSEAPy's GSVA algorithm to assess pathway activity variation across individual samples. - Export Pathway JSON (
src/export_pathway_json.py): Loads GSEA/GSVA report sheets, maps samples to experimental conditions using regex patterns, compiles parameters, and exports compressed payloads (gsea_data.json.gz,gsva_data.json.gz) for frontend display.
💡 GSEA vs. GSVA Guidelines:
- GSEA (Contrast-level): Ranks all genes by log2FoldChange to identify pathways shifting between treatments. Look at the **NES (Normalized Enrichment Score)**: a positive NES indicates upregulation in the treated condition, while a negative NES indicates downregulation.
- GSVA (Sample-level): Computes enrichment scores for individual samples, highlighting sample heterogeneity and outliers. Useful for identifying whether specific replicates differ in biological pathway activity.
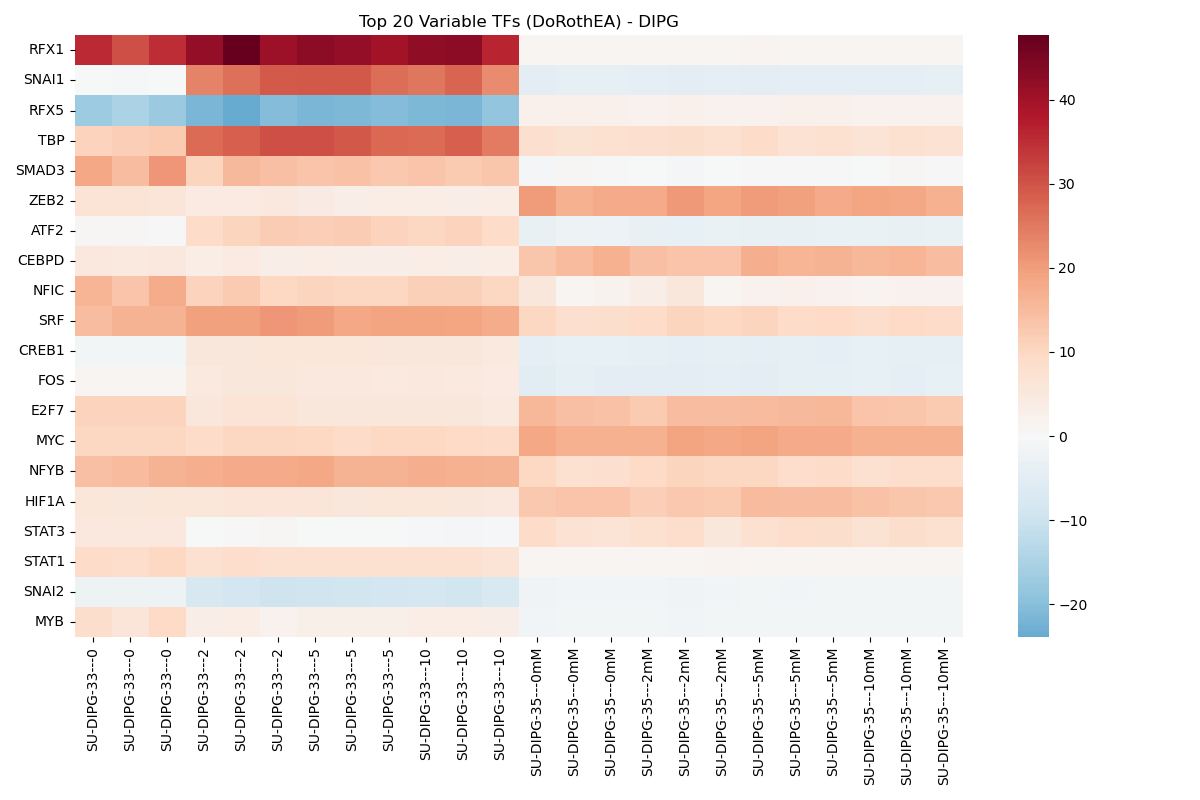
Transcription Factor Activity
Transcription factor activity scores inferred using decoupler with the DoRothEA network.
Dynamic Transcription Factor Activity Dose-Response Viewer
⚙️ Pipeline Logic (src/tf_metabolic_analysis.py & src/export_tf_metabolic_json.py):
- Transcription Factor Activity (DoRothEA & CollecTRI):
- Sample-level: Runs Multivariate Linear Model (
dc.mt.mlm) on the sample-by-gene matrix to infer TF activity scores based on target gene expression. - Contrast-level: Runs Univariate Linear Model (
dc.mt.ulm) using DGE contrast Log2FC vectors to determine TF activation state changes.
- Sample-level: Runs Multivariate Linear Model (
- Network Graph Building (DoRothEA & CollecTRI):
- Identifies contrasts in output folders and parses target link sheets (
targets_<Contrast>.csv) to map source nodes (regulators) and target nodes (genes) with edge Mode of Regulation (mor). - Merges Ensembl descriptions and DGE results (Log2FC, padj) into gene nodes, and activity z-scores/p-values into regulatory nodes, exporting node-link schemas to compressed JSON files (
tf_network.json.gzandcollectri_network.json.gz).
- Identifies contrasts in output folders and parses target link sheets (
Metabolic & Signaling Profiles
Pathway and signaling activities inferred using decoupler for Hallmark Gene Sets and PROGENy Pathways.
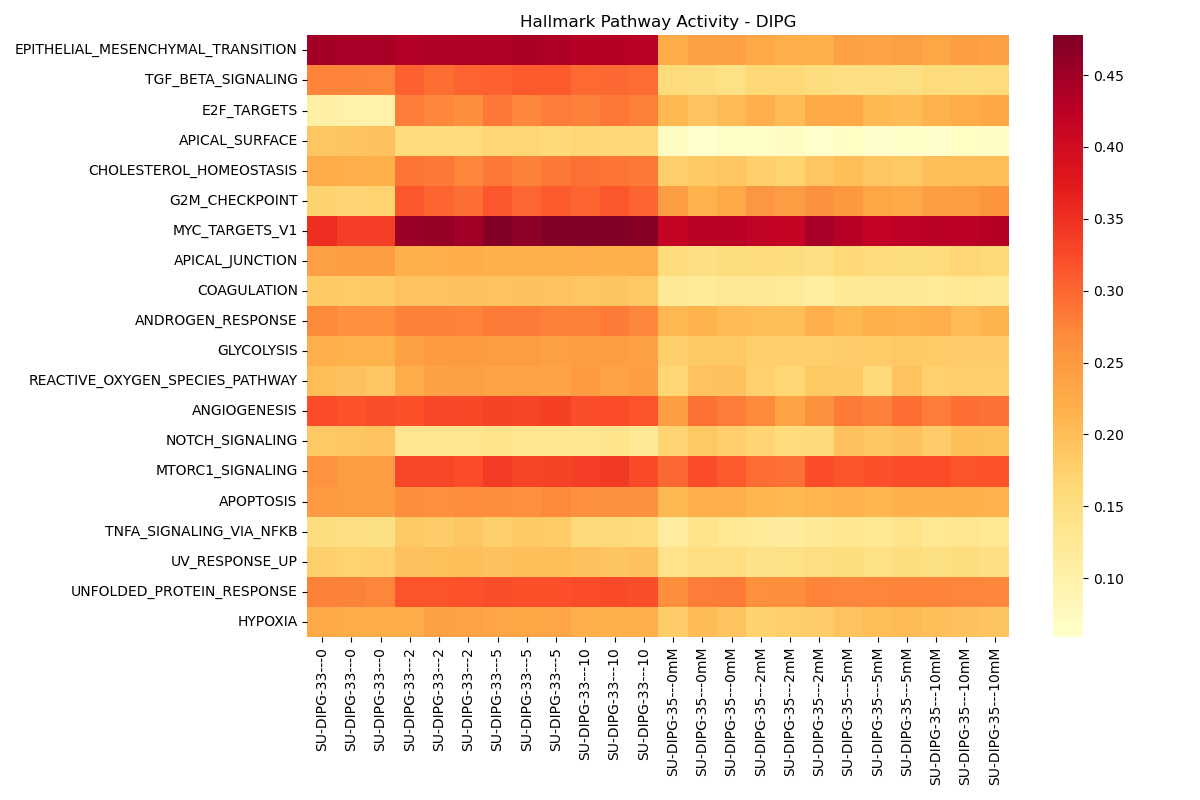
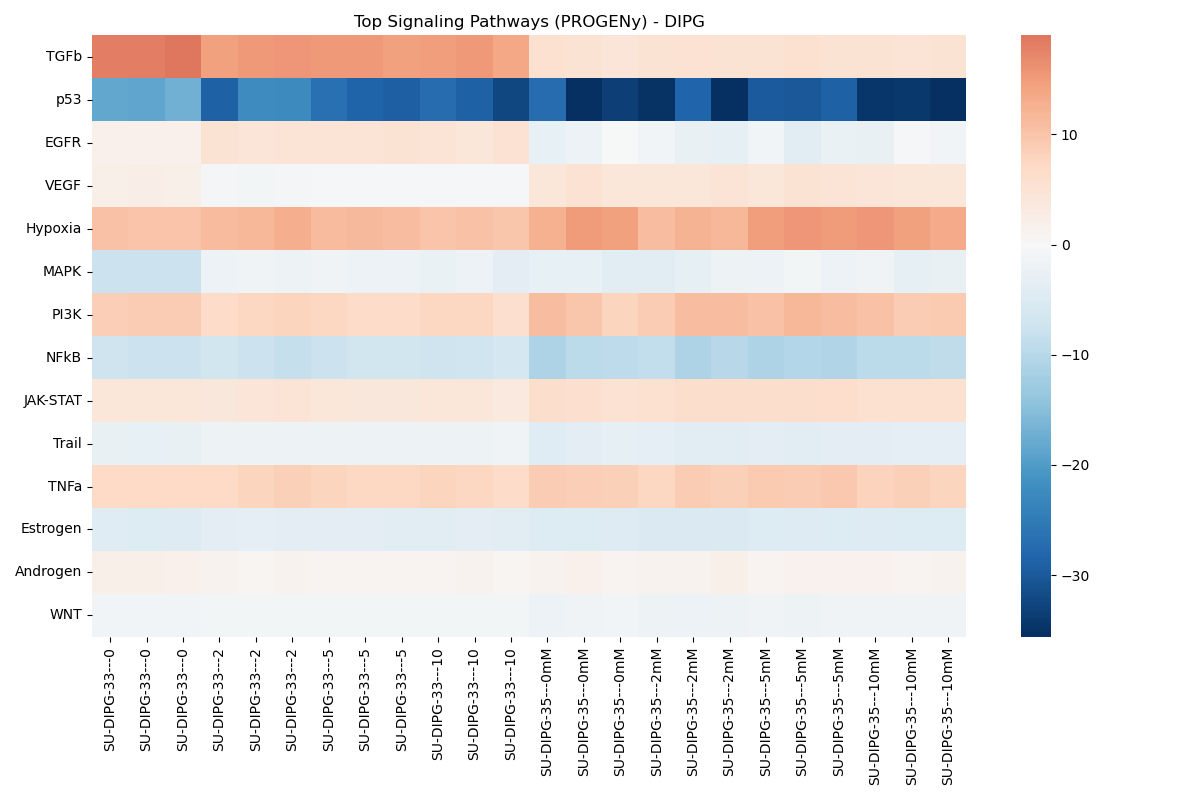
Dynamic Signaling Pathway Activity Dose-Response Viewer
⚙️ Pipeline Logic (src/tf_metabolic_analysis.py & src/export_tf_metabolic_json.py):
- Signaling Pathway Profiling (PROGENy):
- Sample-level: Runs
dc.mt.mlmusing PROGENy pathway weight matrices to determine pathway activation. - Contrast-level: Runs
dc.mt.ulmon DGE contrast Log2FC vectors to determine signaling pathway activity changes.
- Sample-level: Runs
- Hallmark Pathways Activity:
- Sample-level: Evaluates sample-specific pathway enrichment utilizing the AUCell algorithm (
dc.mt.aucell). - Contrast-level: Runs
dc.mt.ulmon DGE contrast Log2FC vectors.
- Sample-level: Evaluates sample-specific pathway enrichment utilizing the AUCell algorithm (
- Network Graph Building (PROGENy & Hallmark):
- Parses target link sheets to map source nodes (pathways) and target genes, merging activity z-scores, p-values, and target LFC/padj metrics.
- Exports compressed network schemas (
progeny_network.json.gzandhallmark_network.json.gz) for visualization.